Fig. 9
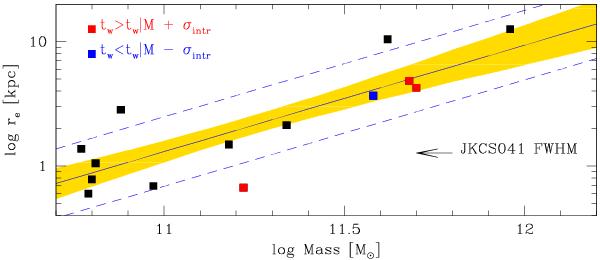
Size–mass relation for JKCS 041. Lines show the mean fitted model and its uncertainty (solid line and yellow band), along with the intrinsic scatter (dotted line). Points are color-coded according to their location in the age–mass plane (Fig. 7): older (red) or younger (blue) than the mean relation by at least 1σintr, with black points indicating galaxies within ± 1σintr the mean age–mass relation.
Current usage metrics show cumulative count of Article Views (full-text article views including HTML views, PDF and ePub downloads, according to the available data) and Abstracts Views on Vision4Press platform.
Data correspond to usage on the plateform after 2015. The current usage metrics is available 48-96 hours after online publication and is updated daily on week days.
Initial download of the metrics may take a while.