Fig. 8
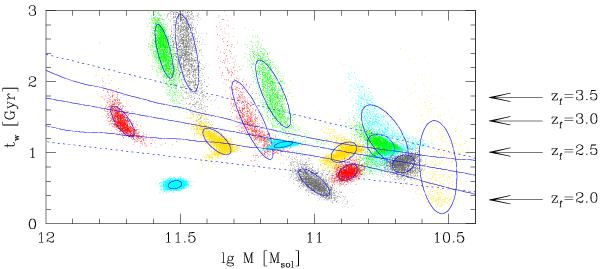
Age–mass relation for red-sequence galaxies in JKCS 041. The clouds of colored points show the probability distribution for each individual galaxy, following the color coding in Fig. 7; ellipses show Laplace approximations. The straight solid line is the mean age–mass relation derived from these posteriors, based on the galaxy spectra and photometry. Fan-shaped lines delineate the error on the mean model (68% highest posterior interval), while the dotted lines indicate the intrinsic scatter (±1σ).
Current usage metrics show cumulative count of Article Views (full-text article views including HTML views, PDF and ePub downloads, according to the available data) and Abstracts Views on Vision4Press platform.
Data correspond to usage on the plateform after 2015. The current usage metrics is available 48-96 hours after online publication and is updated daily on week days.
Initial download of the metrics may take a while.