Fig. 11
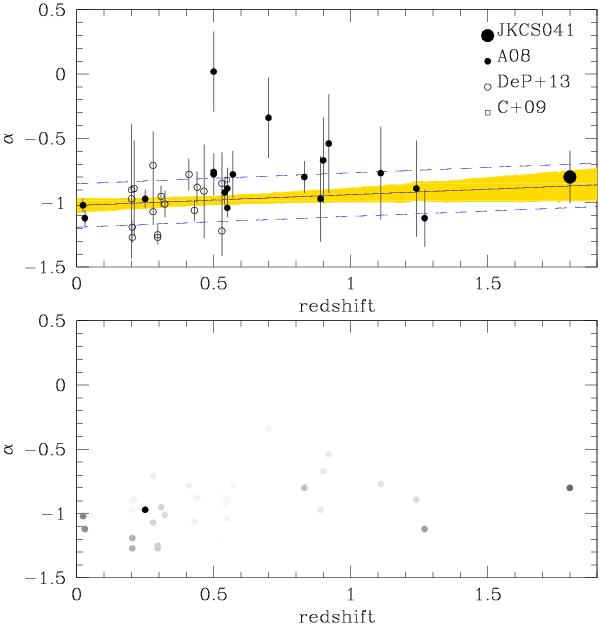
Faint-end slope of the luminosity function of red-sequence galaxies of 42 clusters spanning over 10 Gyr of the age of the Universe. Top panel: open dots are from De Propris et al. (2013), the open square represents the Crawford et al. (2012) determination, while solid dots are our own work (this work or Andreon 2008 and references therein). Some points indicates stacks of two or ten clusters. The solid line is the mean model, while the shaded area represent the 68% uncertainty (highest posterior density interval) of the mean relation. Bottom panel: as in the top panel, with the amount of ink is proportional to the weight given to each point in the fit.
Current usage metrics show cumulative count of Article Views (full-text article views including HTML views, PDF and ePub downloads, according to the available data) and Abstracts Views on Vision4Press platform.
Data correspond to usage on the plateform after 2015. The current usage metrics is available 48-96 hours after online publication and is updated daily on week days.
Initial download of the metrics may take a while.