Fig. 7
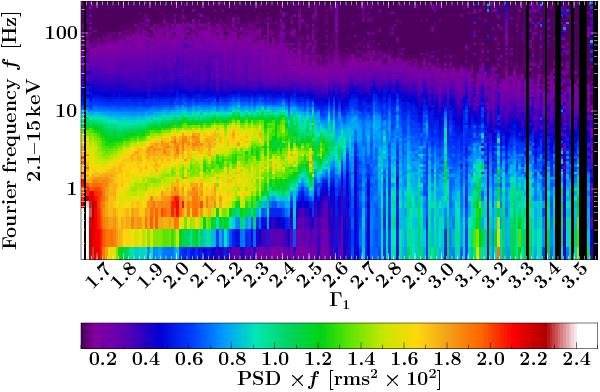
Evolution of PSDs in 2.1–15 keV band (sum of bands 1–4 and full energy range of the B_2ms_8B_0_35_Q mode) with spectral shape. The color scale represents averaged PSD(fi) × fi values at individual Fourier frequencies fi. In this and in all following figures, black vertical lines are photon indices for which no data are available.
Current usage metrics show cumulative count of Article Views (full-text article views including HTML views, PDF and ePub downloads, according to the available data) and Abstracts Views on Vision4Press platform.
Data correspond to usage on the plateform after 2015. The current usage metrics is available 48-96 hours after online publication and is updated daily on week days.
Initial download of the metrics may take a while.