Free Access
Fig. 10
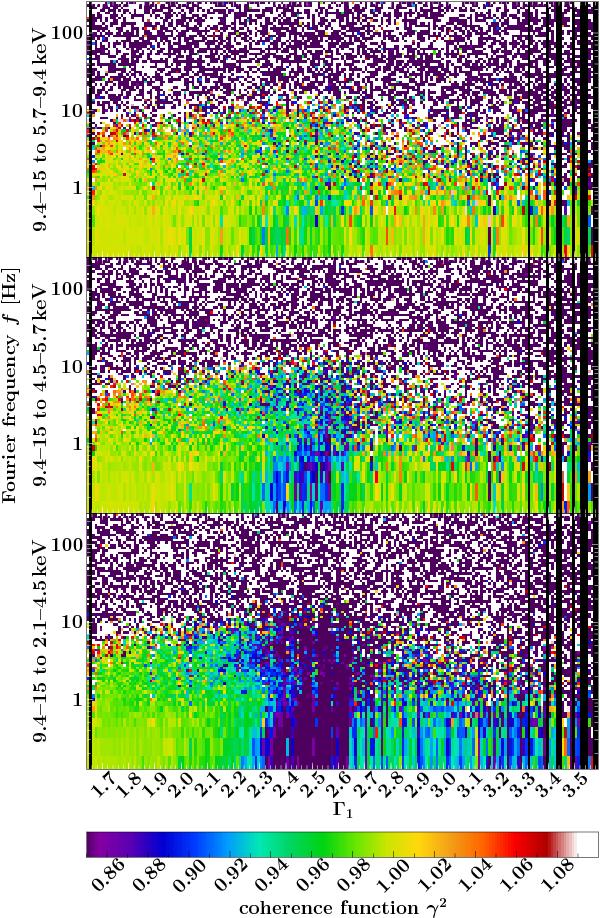
Evolution of the coherence, γ2, with spectral shape represented by the soft photon index Γ1 of the broken power law. The color scale represents averaged γ2 values at individual Fourier frequencies fi. Upper panel:  between bands 4 and 3, middle panel:
  between bands 4 and 2, lower panel:
  between bands 4 and 1.
Current usage metrics show cumulative count of Article Views (full-text article views including HTML views, PDF and ePub downloads, according to the available data) and Abstracts Views on Vision4Press platform.
Data correspond to usage on the plateform after 2015. The current usage metrics is available 48-96 hours after online publication and is updated daily on week days.
Initial download of the metrics may take a while.