Fig. 1
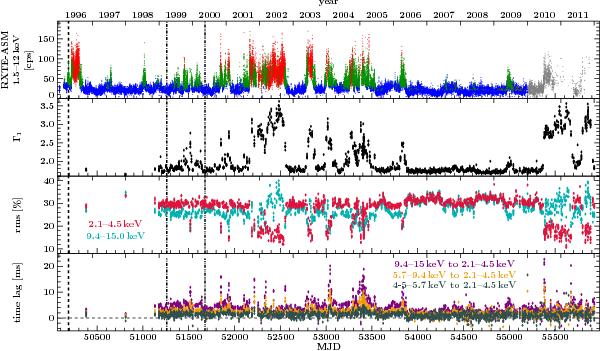
Evolution of Cyg X-1 over the RXTE lifetime. Vertical lines represent the starting times of the RXTE calibration epochs used in this work: dashed line for epoch 3, dot-dashed line for epoch 4, and dot-dot-dashed line for epoch 5. The total ASM count rate is color-coded according to ASM-based state definition of Grinberg et al. (2013), which uses both ASM count rate and ASM hardness of a given measurement: blue represents the hard state, green the intermediate state, and red the soft state. ASM data points after MJD 55 200 are affected by instrumental decline (Vrtilek & Boroson 2013; Grinberg et al. 2013) and shown in gray. The soft photon index Γ1 is shown only for those 1980 RXTE observations that were conducted in the B_2ms_8B_0_35_Q binned data mode, see Sect. 2.3. The rms is calculated in the 0.125–256 Hz range (Sect. 3.1), the time lags are averaged values in the 3.2–10 Hz range (Sect. 4.3).
Current usage metrics show cumulative count of Article Views (full-text article views including HTML views, PDF and ePub downloads, according to the available data) and Abstracts Views on Vision4Press platform.
Data correspond to usage on the plateform after 2015. The current usage metrics is available 48-96 hours after online publication and is updated daily on week days.
Initial download of the metrics may take a while.