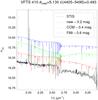
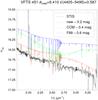
Fig. 8

STIS spectrophotometry of VFTS 410 (left) and VFTS 451 (right) compared with their synthetic SEDs from experiment 1 (CCM, green), 3 (new, red), and alternate 1 (F99, blue) shifted vertically for a better comparison. The error bars show the input F336W + F438W + F555W photometry and the colored star symbols the model photometry (with the same color coding as the SEDs).
Current usage metrics show cumulative count of Article Views (full-text article views including HTML views, PDF and ePub downloads, according to the available data) and Abstracts Views on Vision4Press platform.
Data correspond to usage on the plateform after 2015. The current usage metrics is available 48-96 hours after online publication and is updated daily on week days.
Initial download of the metrics may take a while.