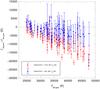
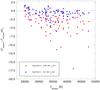
Fig. 7

Results for experiments 2 (red) and 4 (blue). The left panel shows the difference between the fitted Teff (derived from the photometry with CHORIZOS) and the Teff derived from the spectral classification (assumed to be the real Teff) as a function of the latter. The right panel is the same plot but with the vertical axis normalized by the uncertainties (an ideal solution would have a mean of zero and a standard deviation of 1 without depending on Teff). Note that a small amount of random noise (standard deviation of 200 K) has been introduced in the horizontal values to decrease the superposition between different objects.
Current usage metrics show cumulative count of Article Views (full-text article views including HTML views, PDF and ePub downloads, according to the available data) and Abstracts Views on Vision4Press platform.
Data correspond to usage on the plateform after 2015. The current usage metrics is available 48-96 hours after online publication and is updated daily on week days.
Initial download of the metrics may take a while.