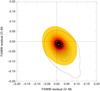
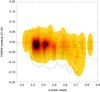
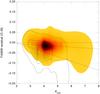
Fig. 4

Integrated residuals (observed minus best model and calculated assuming bidimensional Gaussian distributions for each individual point) for (top) F438W vs. F336W, (middle) F438W vs. E(4405 − 5495), and (bottom) F438W vs. R5495 in experiments 1 and 3. The results for experiment 1 are shown as black and white contour plots and are the result of integrating the data in Fig. 2 (note that a slightly smaller range of magnitudes is shown here). The results for experiment 3 are shown as color-filled density diagrams. The three small squares in the top panel mark the centers of the distributions for experiments 1 and 3 and for the ideal solution. The dotted lines in the bottom panels are the linear fits to the residuals for experiments 1 and 3 and the ideal solution.
Current usage metrics show cumulative count of Article Views (full-text article views including HTML views, PDF and ePub downloads, according to the available data) and Abstracts Views on Vision4Press platform.
Data correspond to usage on the plateform after 2015. The current usage metrics is available 48-96 hours after online publication and is updated daily on week days.
Initial download of the metrics may take a while.