Fig. 2
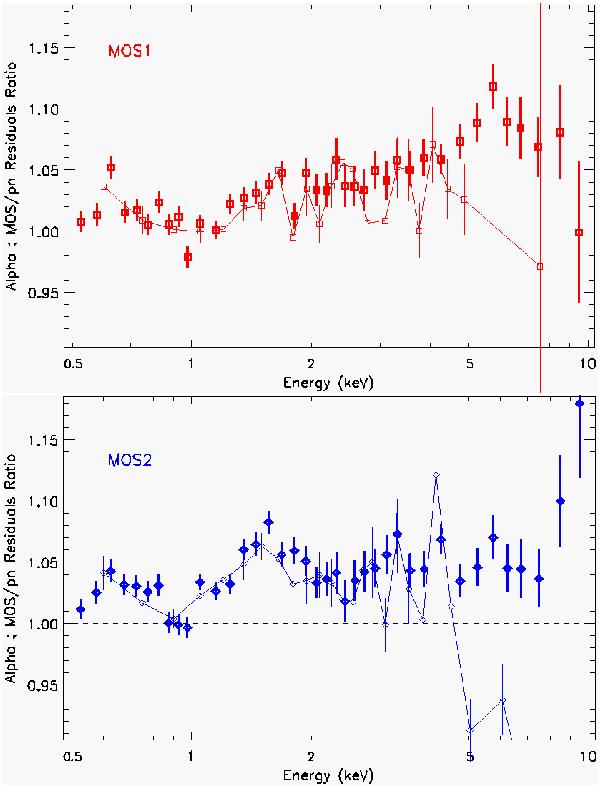
How MOS1 (top panel) and MOS2 (bottom panel) vary with respect to pn. α ratios for MOS1/pn (red) and for MOS2/pn (blue) are plotted against energy (bold points). The data have been adaptively binned to follow the statistics. The faint points, connected by a thin line, show the results obtained using the “fit and stack” (see Sect. 4) analysis (the last MOS2/pn point is at α ≈ 0.75).
Current usage metrics show cumulative count of Article Views (full-text article views including HTML views, PDF and ePub downloads, according to the available data) and Abstracts Views on Vision4Press platform.
Data correspond to usage on the plateform after 2015. The current usage metrics is available 48-96 hours after online publication and is updated daily on week days.
Initial download of the metrics may take a while.