Fig. 1
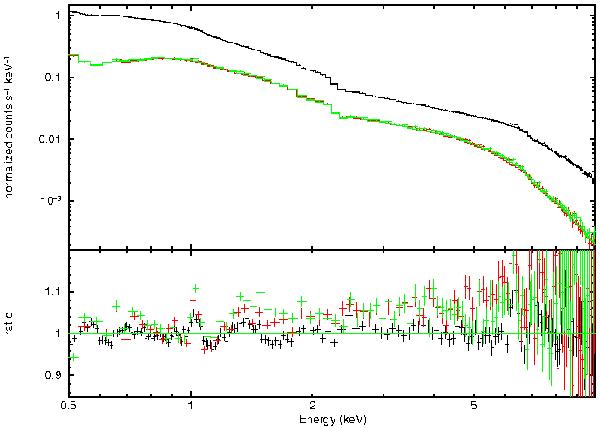
Spectral fitting of the full stacked data from the sample of 46 sources. A phenomenological spectral model is fit closely to the pn data (black points). This model (for details, see text) is then convolved with the instrument responses of MOS1 (red) and MOS2 (green). Data and model are shown in the upper panel, and the residuals are shown in the lower panel. Ratioing the residuals reveals how MOS1 and MOS2 vary with respect to pn.
Current usage metrics show cumulative count of Article Views (full-text article views including HTML views, PDF and ePub downloads, according to the available data) and Abstracts Views on Vision4Press platform.
Data correspond to usage on the plateform after 2015. The current usage metrics is available 48-96 hours after online publication and is updated daily on week days.
Initial download of the metrics may take a while.