Fig. 4
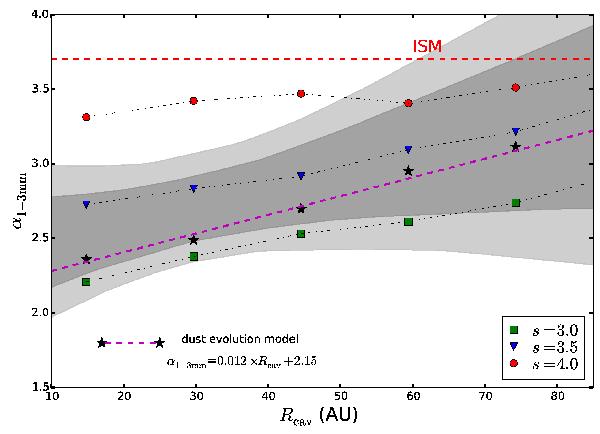
Disk-integrated spectral index α1 − 3 mm vs. the cavity radius for two different kind of models: (1) dust evolution in a disk holding a 1 MJup located at different distances and created different cavity size (stars in the plot). For this case, the best linear fit to this model is also plotted (dashed line). (2) Models without considering dust evolution, but a dust-rich disk, assuming a power-law grain size distribution (n(a) ∝ a− s), with amin = 1 μm, amax given by Eq. (3), three different values for s (s = 3.0, square points; s = 3.5 triangle points, and s = 4.0 circle points), and different truncated radii. The 1 and 2 σ regions from observations (Fig. 2) are also plotted.
Current usage metrics show cumulative count of Article Views (full-text article views including HTML views, PDF and ePub downloads, according to the available data) and Abstracts Views on Vision4Press platform.
Data correspond to usage on the plateform after 2015. The current usage metrics is available 48-96 hours after online publication and is updated daily on week days.
Initial download of the metrics may take a while.