Fig. 8
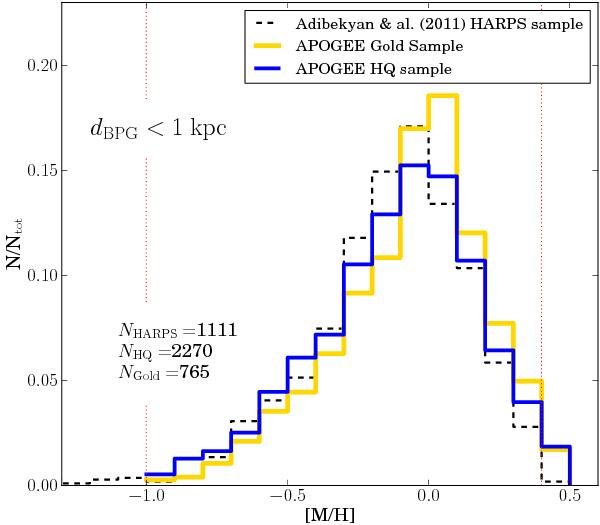
“Local” metallicity distribution for the HARPS FGK dwarf sample of Adibekyan et al. (2011) and the APOGEE HQ and Gold red giant samples (dark and light grey histograms, respectively). The dotted vertical line at [Fe/H] =−1.0 indicates our adopted metallicity limit for the HQ sample, while the line at +0.4 indicates a possible upper reliabilty limit for ASPCAP metallicities.
Current usage metrics show cumulative count of Article Views (full-text article views including HTML views, PDF and ePub downloads, according to the available data) and Abstracts Views on Vision4Press platform.
Data correspond to usage on the plateform after 2015. The current usage metrics is available 48-96 hours after online publication and is updated daily on week days.
Initial download of the metrics may take a while.