Fig. 3
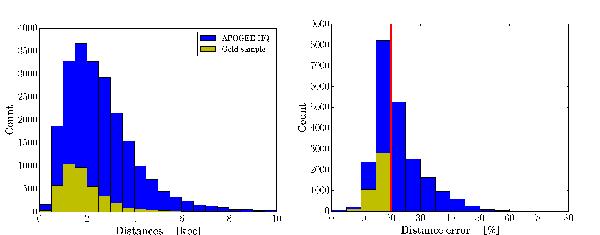
Histogram of the distribution of spectrophotometric distances and their errors for the HQ (blue) and the Gold sample. Note that, in addition to the cut in relative distance error, indicated by the thick vertical line in the right panel, the Gold sample also satisfies a quality criterion for proper motions (see Sect. 3.2).
Current usage metrics show cumulative count of Article Views (full-text article views including HTML views, PDF and ePub downloads, according to the available data) and Abstracts Views on Vision4Press platform.
Data correspond to usage on the plateform after 2015. The current usage metrics is available 48-96 hours after online publication and is updated daily on week days.
Initial download of the metrics may take a while.