Fig. 2
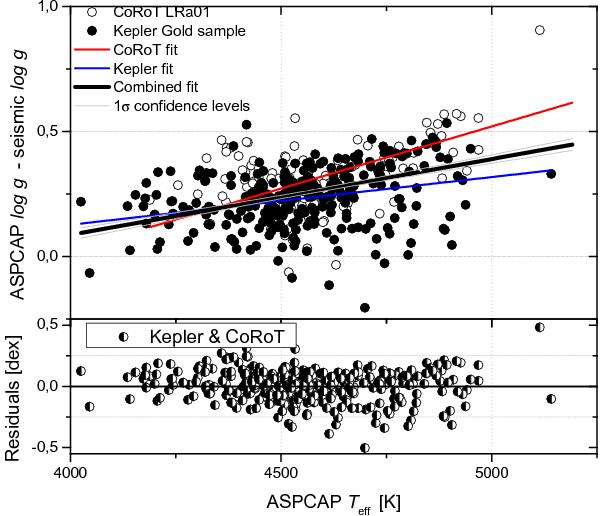
Illustration of the applied log g calibration using asteroseismology data. ASPCAP DR10 log g is higher with respect to the seismic values by on average ~ 0.25 dex, with the discrepancy increasing with increasing effective temperature. A linear fit using only CoRoT data (115 stars, open circles) is given by the light grey line, a fit using only Kepler data (279 stars, black circles) is indicated by the dark grey line. The fit obtained by combining the two datasets is illustrated by the thick black line. The lower panel shows the residuals, revealing some remaining possible systematics.
Current usage metrics show cumulative count of Article Views (full-text article views including HTML views, PDF and ePub downloads, according to the available data) and Abstracts Views on Vision4Press platform.
Data correspond to usage on the plateform after 2015. The current usage metrics is available 48-96 hours after online publication and is updated daily on week days.
Initial download of the metrics may take a while.