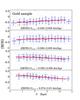
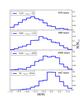
Fig. 15
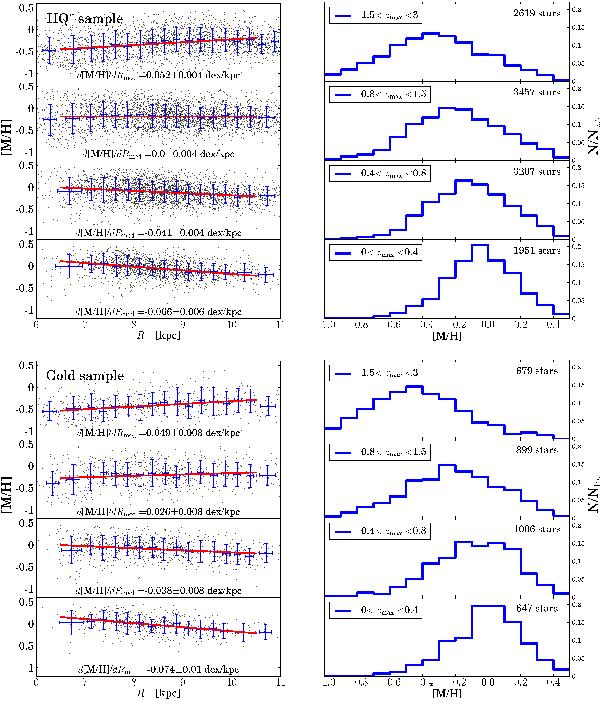
Top: radial metallicity gradients (using the median orbital radii Rmed) and metallicity distribution functions as a function of zmax for the HQ sample. The gradients were computed using a simple least-squares optimisation, errors were estimated via bootstrapping. Note that we still do not account for any selection biases. Bottom: same for the Gold sample.
Current usage metrics show cumulative count of Article Views (full-text article views including HTML views, PDF and ePub downloads, according to the available data) and Abstracts Views on Vision4Press platform.
Data correspond to usage on the plateform after 2015. The current usage metrics is available 48-96 hours after online publication and is updated daily on week days.
Initial download of the metrics may take a while.