Fig. 1
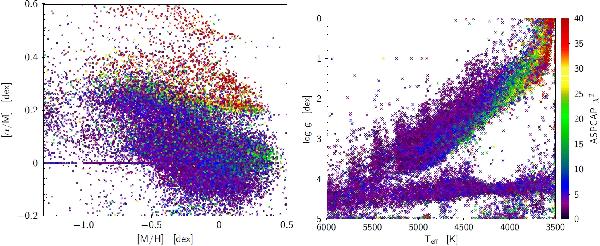
Two 2D slices through the 6-dimensional hypercube of ASPCAP parameter space, colour-coded by χ2. Left panel: [α/M] vs. [M/H], the so-called “chemical plane”. Some artificial features introduced by ASPCAP are also visible (the region of unphysical, poorly converged best-fit models appearing in red; the line at [α/M] = 0.0 corresponding to the A and F dwarfs forced to solar α-abundances; see Sect. 2.2 for details). Right panel: the ASPCAP Kiel diagram (Teff vs. log g). Giant stars lie on the diagonal branch, while main sequence stars are aligned in the horizontal sequence in the lower part of the diagram. The latter behaviour is somewhat unphysical – cooler main sequence stars should have higher surface gravities – and shows that the pipeline is not optimised for dwarf stars yet.
Current usage metrics show cumulative count of Article Views (full-text article views including HTML views, PDF and ePub downloads, according to the available data) and Abstracts Views on Vision4Press platform.
Data correspond to usage on the plateform after 2015. The current usage metrics is available 48-96 hours after online publication and is updated daily on week days.
Initial download of the metrics may take a while.