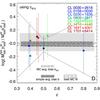
Fig. A.2
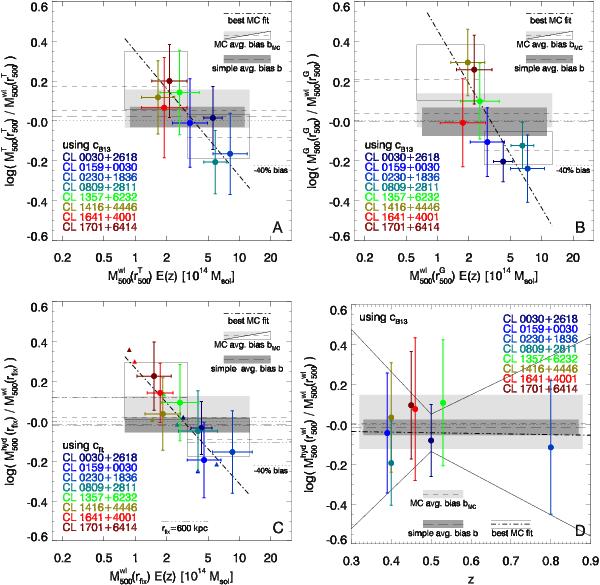
Continuation of Fig. 2. Panel A)
shows log (MT/Mwl)
within  ,
panel B) shows log (MG/Mwl)
within
,
panel B) shows log (MG/Mwl)
within  . Like
panel A) of Fig. 2, panel
C) presents log (Mhyd/Mwl),
but showing both WL masses measured at a fixed physical radius rfix.
Filled dots and dot-dashed lines correspond to rfix = 800
kpc, while triangles and triple-dot-dashed lines denote
rfix =
600 kpc. Uncertainties for the 600 kpc case were omitted for
clarity. Panel D) shows log (Mhyd/Mwl)
from Fig. 2 as a function of redshift. Thin
solid lines indicating the 1σ uncertainty range of the best-fit Monte
Carlo/jackknife regression line (dot-dashed).
. Like
panel A) of Fig. 2, panel
C) presents log (Mhyd/Mwl),
but showing both WL masses measured at a fixed physical radius rfix.
Filled dots and dot-dashed lines correspond to rfix = 800
kpc, while triangles and triple-dot-dashed lines denote
rfix =
600 kpc. Uncertainties for the 600 kpc case were omitted for
clarity. Panel D) shows log (Mhyd/Mwl)
from Fig. 2 as a function of redshift. Thin
solid lines indicating the 1σ uncertainty range of the best-fit Monte
Carlo/jackknife regression line (dot-dashed).
Current usage metrics show cumulative count of Article Views (full-text article views including HTML views, PDF and ePub downloads, according to the available data) and Abstracts Views on Vision4Press platform.
Data correspond to usage on the plateform after 2015. The current usage metrics is available 48-96 hours after online publication and is updated daily on week days.
Initial download of the metrics may take a while.