Fig. 2
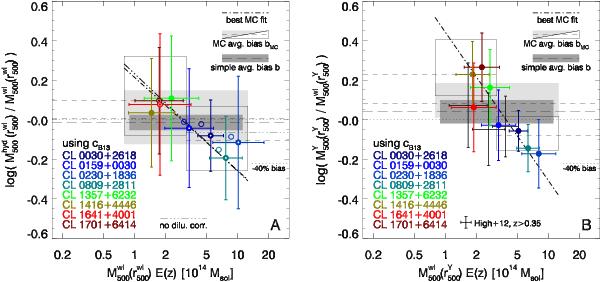
Ratios between X-ray and WL masses as a function of WL mass. Panel A)
shows log (Mhyd/Mwl)
within  , panel
B) shows log (MY/Mwl)
within
, panel
B) shows log (MY/Mwl)
within  . WL
masses assume the B13 c–M relation. We show three tests for a mass
bias: the overall average logarithmic bias b = ⟨
log MX − log Mwl
⟩ is denoted by a long-dashed line, and its standard error by a
dark grey shading. Short-dashed lines and light grey shading denote the same
quantity, but obtained from averaging over Monte Carlo realisations including the
jackknife test. We also show this bMC for the low-Mwl and
high-Mwl clusters separately, with the
1σ
uncertainties presented as boxes, for sake of clarity. As a visual aid, a dot-dashed
line depicts the Monte Carlo/jackknife best-fit of log (MX/Mwl)
as a function of Mwl. In addition, panel A)
also contains this best-fit line (triple-dot-dashed) for the case without
correction for cluster member dilution; the corresponding data points follow the
Fig. 1 scheme. Indicated by uncertainty bars,
panel B) also presents three high-z clusters from High et al. (2012).
. WL
masses assume the B13 c–M relation. We show three tests for a mass
bias: the overall average logarithmic bias b = ⟨
log MX − log Mwl
⟩ is denoted by a long-dashed line, and its standard error by a
dark grey shading. Short-dashed lines and light grey shading denote the same
quantity, but obtained from averaging over Monte Carlo realisations including the
jackknife test. We also show this bMC for the low-Mwl and
high-Mwl clusters separately, with the
1σ
uncertainties presented as boxes, for sake of clarity. As a visual aid, a dot-dashed
line depicts the Monte Carlo/jackknife best-fit of log (MX/Mwl)
as a function of Mwl. In addition, panel A)
also contains this best-fit line (triple-dot-dashed) for the case without
correction for cluster member dilution; the corresponding data points follow the
Fig. 1 scheme. Indicated by uncertainty bars,
panel B) also presents three high-z clusters from High et al. (2012).


Current usage metrics show cumulative count of Article Views (full-text article views including HTML views, PDF and ePub downloads, according to the available data) and Abstracts Views on Vision4Press platform.
Data correspond to usage on the plateform after 2015. The current usage metrics is available 48-96 hours after online publication and is updated daily on week days.
Initial download of the metrics may take a while.