| Issue |
A&A
Volume 564, April 2014
|
|
|---|---|---|
| Article Number | A84 | |
| Number of page(s) | 9 | |
| Section | Stellar structure and evolution | |
| DOI | https://doi.org/10.1051/0004-6361/201322818 | |
| Published online | 10 April 2014 | |
Characterizing AGB stars in Wide-field Infrared Survey Explorer (WISE) bands⋆
1
Center for Astrophysics, University of Science and Technology of
China,
230026
Hefei,
PR China
e-mail: ljhhw@mail.ustc.edu.cn; zhuqf@ustc.edu.cn; xkong@ustc.edu.cn
2
Key Laboratory for Research in Galaxies and Cosmology, Chinese
Academy of Sciences, 230026
Hefei, PR
China
3
Key Laboratory for the Structure and Evolution of Celestial
Objects, Yunnan Observatories, CAS,
650011
Kunming, PR
China
Received:
8
October
2013
Accepted:
20
February
2014
Aims. Since asymptotic giant branch (AGB) stars are bright and extended infrared objects, most Galactic AGB stars saturate the Wide-field Infrared Survey Explorer (WISE) detectors and therefore the WISE magnitudes that are restored by applying point-spread-function fitting need to be verified. Statistical properties of circumstellar envelopes around AGB stars are discussed on the basis of a WISE AGB catalog verified in this way.
Methods. We cross-matched an AGB star sample with the WISE All-Sky Source Catalog and the Two Mircon All Sky Survey catalog. Infrared Space Observatory (ISO) spectra of a subsample of WISE AGB stars were also exploited. The dust radiation transfer code DUSTY was used to help predict the magnitudes in the W1 and W2 bands, the two WISE bands most affected by saturation, for calibration purpose, and to provide physical parameters of the AGB sample stars for analysis.
Results. DUSTY is verified against the ISO spectra to be a good tool to reproduce the spectral energy distributions of these AGB stars. Systematic magnitude-dependent offsets have been identified in WISE W1 and W2 magnitudes of the saturated AGB stars, and empirical calibration formulas are obtained for them on the basis of 1877 (W1) and 1558 (W2) AGB stars that are successfully fit with DUSTY. According to the calibration formulas, the corrections for W1 at 5 mag and W2 at 4 mag are −0.383 and 0.217 mag, respectively. In total, we calibrated the W1/W2 magnitudes of 2390/2021 AGB stars. The model parameters from the DUSTY and the calibrated WISE W1 and W2 magnitudes are used to discuss the behavior of the WISE color–color diagrams of AGB stars. The model parameters also reveal that O-rich AGB stars with opaque circumstellar envelopes are much rarer than opaque C-rich AGB stars toward the anti-Galactic center direction, which we attribute to the metallicity gradient of our Galaxy.
Key words: stars: AGB and post-AGB / stars: carbon / stars: evolution / infrared: stars / radiative transfer
The synthetic photometry and input parameters for the model grid are only available at the CDS via anonymous ftp to cdsarc.u-strasbg.fr (130.79.128.5) or via http://cdsarc.u-strasbg.fr/viz-bin/qcat?J/A+A/564/A84
© ESO, 2014
1. introduction
The asymptotic giant branch (AGB) phase is the final stellar evolutionary stage of intermediate-mass (1–8 M⊙) stars driven by nuclear burning. Stars in this stage have low surface effective temperatures (below 3000 K) and experience intense mass loss (from 10-7 to 10-4M⊙ yr-1) (Habing 1996). Heavy elements in the mass outflow from a central star will condense to form dust when the gas temperature drops to the sublimation temperature of the dust grains. Dusty circumstellar envelopes will form at the distance of several stellar radii. Dust grains in the envelopes absorb stellar radiation and re-emit in the infrared. Thus, AGB stars are important infrared sources. The mass-loss process plays an important role in the evolution of AGB stars because it affects the lifetime of the AGB phase and the core-mass of the subsequent post-AGB stars. Statistics of a large sample of AGB stars would help to constrain the evolution of dust envelope. Due to the relative over-abundance between carbon and oxygen, there are two main types of AGB stars: (1) the O-rich with C/O < 1 and mainly silicate-type grains in the outflow; and (2) C-rich with C/O > 1 and mainly carbonaceous grains in the envelopes. The different dust compositions of these two types of AGB stars result in different infrared spectral features, which can be used to distinguish the two groups of the stellar objects.
The first-generation infrared space-telescope, the Infrared Astronomical Satellite (IRAS;
Neugebauer et al. 1984), mapped the sky in two
mid-infrared and two far-infrared bands (12, 25 μm and 60, 100 μm, respectively) in the
1980s. It discovered many mass-losing AGB stars in the Milky Way and the Magellanic Clouds.
Several dozen AGB stars were observed spectroscopically by the Infrared Space Observatory
(ISO; Kessler et al. 1996) with the Short-Wave
Spectrometer (SWS) on board, which works in the range of 2.4 μm to 45 μm. These infrared spectra
provide tremendous information about dusty circumstellar envelopes around the AGB stars, but
they are limited by the sample size. The Galactic Plane Survey of the Spitzer
Space Telescope (Werner et al. 2004)
provides high-resolution and sensitive infrared images of Galactic plane at the 3.6, 4.5,
5.8, 8.0, 24, and 70 μm bands. However, it cannot adequately separate the
two types of AGB stars in mid-infrared color–color diagrams without filters between 8
μm and 24
μm. Launched
on 2009 December 14, the Wide-field Infrared Survey Explorer (WISE) completed an entire sky
survey in the 3.4, 4.6, 12 and 22 μm bands (hereafter named W1, W2, W3, and W4, respectively) in 2010.
The FWHMs of the point spread functions (PSF) are  ,
,  ,
,  , and
, and
 for the four WISE bands, and the
sensitivities (5σ) of the point sources are 0.08, 0.11, 1, and 6 mJy
(Wright et al. 2010). The Two Micron All Sky Survey
(2MASS; Skrutskie et al. 2006) also mapped the entire
sky in three near-infrared, J (1.25 μm), H (1.65 μm) and Ks (2.17 μm) bands. They are an
important supplement to the mid-infrared WISE data to complete the infrared spectral energy
distribution (SED) of AGB stars.
for the four WISE bands, and the
sensitivities (5σ) of the point sources are 0.08, 0.11, 1, and 6 mJy
(Wright et al. 2010). The Two Micron All Sky Survey
(2MASS; Skrutskie et al. 2006) also mapped the entire
sky in three near-infrared, J (1.25 μm), H (1.65 μm) and Ks (2.17 μm) bands. They are an
important supplement to the mid-infrared WISE data to complete the infrared spectral energy
distribution (SED) of AGB stars.
Recently, galaxy-wide AGB populations have been identified and studied in nearby galaxies using ground- and space-based near- and mid-infrared data (Riebel et al. 2012; Boyer et al. 2012 in the Magellanic Clouds and Javadi et al. 2013 in M33). While similar research in our galaxy is hindered by foreground extinction, there are some studies on large datasets of Galactic AGB stars, such as the work of Jura & Kleinmann (1989) in the solar neighborhood. Suh & Kwon (2009, 2011) composed a large verified AGB catalog in our galaxy from the literature and investigated infrared colors of AGB stars and their distribution in color–color diagrams. To study an AGB star population, a more time-saving way is constructing a set of model grids to simulate the infrared SED of AGB stars and acquire their physical parameters, such as mass-loss rate and optical depth. Many model grids have been developed to study the evolved-star populations in the local group galaxies (Groenewegen 2006; Sargent et al. 2011; Srinivasan et al. 2011). All of the models are publicly available. However, the model set of Groenewegen (2006) does not have WISE synthetic photometry. The Magellanic Clouds have a lower metallicity than our Galaxy, and Sargent et al. (2011) and Srinivasan et al. (2011) chose a stellar photosphere model with subsolar metallicity as input of a radiative transfer model, which is not the case in our galaxy. Therefore, we used DUSTY (Ivezic & Elitzur 1997) to generate a new grid of radiative transfer models to simulate the infrared SEDs of Galactic AGB stars.
As AGB stars typically are bright IR objects, most of our AGB samples are brighter than the WISE detector saturation limits and only photometry of unsaturated pixels are available, therefore their WISE magnitudes need to be verified. The main goal of this paper is to study the properties of AGB stars in WISE bands and recalibrate the WISE photometry for sources saturated in WISE bands. We describe our AGB sample, DUSTY algorithm and calibration method in Sect. 2. A possible calibrating solution is presented in Sect. 3.1. We present our results about the distinct location of the two types of AGB stars in a color–color diagram in Sect. 3.2, the model parameter effects on WISE colors in Sect. 3.3, and the Galactic longitude distribution in Sect. 3.4. Our summary is presented in Sect. 4. All the magnitudes mentioned in this paper are Vega magnitudes.
2. Sample and method
2.1. AGB sample
Suh & Kwon (2009) composed a catalog of Galactic AGB stars based on reports of the IRAS Low Resolution Spectrograph (LRS; λ = 8–22 μm), ISO Short-Wave Spectrometer (SWS), the Near Infrared Spectrometer (NIRS; 1.4–4.0 μm; Murakami et al. 1994), radio OH and SiO survey (Lewis et al. 1990), the Midcourse Space Experiment (MSX; Egan et al. 2003) and the 2MASS data. Suh & Kwon (2011) (hereafter Suh11) updated the catalog with SiO maser sources for O-rich AGB stars and additional sources for C-rich AGB stars. The updated catalog contains 3003 O-rich and 1168 C-rich AGB stars with their IRAS colors and has the largest confirmed AGB collection so far. This catalog provides an important entry for the future study of AGB stars.
To study the properties of AGB stars in infrared bands, we cross-correlated the AGB
catalog with the WISE All Sky Catalog. Because IRAS data have a positional uncertainty
ellipse of 45′′×9′′, which is much bigger than the position uncertainty in
WISE photometry (~ ), we used coordinates and magnitudes
of sources during the cross-correlation to improve the precision. We first used
45′′ as the
searching radius to find matching candidates. In the cases of multiple matches, we
selected the WISE source with the highest 12 μm flux. AGB stars are among the brightest sources
in the sky at mid-infrared wavelengths. The detection limit of IRAS is higher than that of
WISE. All 12 μm IRAS sources needed also to be detected by WISE.
However, high flux saturates the WISE detectors and may render them unreliable. A
selection criterion of W3 fainter than −2 mag was applied to exclude other 70
O-rich and 33 C-rich AGB stars from the sample. This criterion is based on our analysis of
WISE magnitudes and ISO SWS spectra of AGB stars, which is discussed in Sect. 2.3. The
2MASS observations in J, H and Ks bands are included in the WISE
catalog. For each WISE source, the associated 2MASS observations were selected with the
nearest sources in the 2MASS catalog within 3′′. Some of these AGB stars (730 O-rich and 158 C-rich)
do not have a 2MASS counterpart, which is perhaps due to heavy circumstellar extinction.
This tentative interpretation is supported by the fact that their W3–W4 colors (with medians of
1.874 mag for O-rich and 0.993 mag for C-rich objects), which correspond to an optical
depth ~40 at 0.55
μm
(according to our discussion in Sect. 3.2), are much redder than that of the whole AGB
sample (W3–W4 = 1.314 mag for O-rich and 0.454 mag for C-rich
objects). Finally, 2203 (73.6%) O-rich and 958 (83.6%) C-rich AGB stars with 2MASS
observations remained. They are our WISE AGB sample. We did not apply interstellar
extinction correction to our data because there are no distance estimates. The extinction
caused by the interstellar material (ISM) can be included in the extinction of the dust
envelope around AGB stars. We expect that the optical depth is overestimated by a factor
depending on the distance to the Sun and specific sightlines. The good agreement between
DUSTY models and ISO data suggests that our results from estimating the saturated WISE
W1 and
W2
photometry are not affected by interstellar extinction significantly.
), we used coordinates and magnitudes
of sources during the cross-correlation to improve the precision. We first used
45′′ as the
searching radius to find matching candidates. In the cases of multiple matches, we
selected the WISE source with the highest 12 μm flux. AGB stars are among the brightest sources
in the sky at mid-infrared wavelengths. The detection limit of IRAS is higher than that of
WISE. All 12 μm IRAS sources needed also to be detected by WISE.
However, high flux saturates the WISE detectors and may render them unreliable. A
selection criterion of W3 fainter than −2 mag was applied to exclude other 70
O-rich and 33 C-rich AGB stars from the sample. This criterion is based on our analysis of
WISE magnitudes and ISO SWS spectra of AGB stars, which is discussed in Sect. 2.3. The
2MASS observations in J, H and Ks bands are included in the WISE
catalog. For each WISE source, the associated 2MASS observations were selected with the
nearest sources in the 2MASS catalog within 3′′. Some of these AGB stars (730 O-rich and 158 C-rich)
do not have a 2MASS counterpart, which is perhaps due to heavy circumstellar extinction.
This tentative interpretation is supported by the fact that their W3–W4 colors (with medians of
1.874 mag for O-rich and 0.993 mag for C-rich objects), which correspond to an optical
depth ~40 at 0.55
μm
(according to our discussion in Sect. 3.2), are much redder than that of the whole AGB
sample (W3–W4 = 1.314 mag for O-rich and 0.454 mag for C-rich
objects). Finally, 2203 (73.6%) O-rich and 958 (83.6%) C-rich AGB stars with 2MASS
observations remained. They are our WISE AGB sample. We did not apply interstellar
extinction correction to our data because there are no distance estimates. The extinction
caused by the interstellar material (ISM) can be included in the extinction of the dust
envelope around AGB stars. We expect that the optical depth is overestimated by a factor
depending on the distance to the Sun and specific sightlines. The good agreement between
DUSTY models and ISO data suggests that our results from estimating the saturated WISE
W1 and
W2
photometry are not affected by interstellar extinction significantly.
To calibrate the WISE photometry, we cross-matched the Suh11 catalog with sources observed by ISO SWS (spectrum data reduced by Sloan et al. 2003). To obtain a reliable spectral sample, we excluded several O-rich AGB star spectra that deviate significantly from the typical SEDs of AGB stars and lack 10 μm silicate feature. Spectra with a low signal-to-noise ratio were also excluded. Finally, we obtained 67 O-rich and 44 C-rich AGB stars with reliable ISO mid-infrared spectra. Among them, 66 (49) O-rich and 44 (37) C-rich AGB stars have associated WISE (and 2MASS) observations.
2.2. Theoretical modeling
DUSTY is a radiative transfer code developed by Ivezic & Elitzur (1997) and can be used to model the dusty circumstellar envelope around AGB stars. Many authors have used this code to simulate the infrared emission of AGB stars (e.g., Riechers et al. 2004; Matsuura et al. 2006; Groenewegen 2012). Taking the advantage of scaling, Ivezic & Elitzur (1997) minimized the number of input parameters by assuming spherical symmetry. The parameters that have to be specified in models are (1) the input radiation field, which can be described by the effective temperature Teff of the cental star; (2) the optical properties of dust grains with a specified chemical composition; (3) the grain-size distribution n(a); (4) the dust temperature at the inner boundary of the circumstellar envelope Tin; (5) the relative thickness (radius at the outer boundary over radius at the inner boundary, rout/rin) of the envelope; (6) envelope density distribution assuming a power law of ρ(r) ∝ r−α in this work; (7) the overall optical depth at a reference wavelength τλ, and we assumed a reference wavelength at 0.55 μm.
We used DUSTY to generate model templates to simulate the infrared SEDs of AGB stars in our Galaxy. For the radiative field, we took the COMARCS hydrostatic models (Aringer et al. 2009) of AGB star photospheres to represent the C-rich AGB stars and PHOENIX models (Kučinskas et al. 2005) for O-rich AGB stars. Both models assume metallicity Z = Z⊙. As noted in Aringer et al. (2009), most C-rich AGB stars have temperatures lower than 3500 K; the effective temperature of C-rich stellar models in this work ranges from 2500 K to 3500 K with increments of 500 K. For O-rich AGB stars, we used PHOENIX models with stellar effective temperatures between 2100 K and 4500 K in increments of 400 K. The effective temperature increments are larger than in the model grids of Sargent et al. (2011) and Srinivasan et al. (2011), which are 200 and 100 K, respectively, to save calculation time. We explored the effective temperature with increments as small as 100 K and did not find a noticeable increase in the number of AGB stars with good fits. We set the stellar mass for O-rich AGB stars to be 1 M⊙, which is the only available choice in the PHOENIX model and a better choice than a blackbody SED. As shown in Aringer et al. (2009) and Kučinskas et al. (2005), the surface gravities (log (g/(cm s-2))) and C/O ratio have a minor effect on near-infrared colors, therefore we only used COMARCS models with log (g) = −0.4 (when the temperature was higher than 3200 K, only log (g) = −0.2 is available) and C/O = 1.1, and PHOENIX models with log (g) = −0.5 and C/O = 1.1.
Suh11 also used DUSTY to simulate the infrared colors of AGB stars. They assumed that each type of AGB circumstellar envelope contains only two types of dust grains. The circumstellar envelopes of O-rich AGB stars only contain silicate and porous corundum Al2O3. The circumstellar envelopes of C-rich AGB stars contain amorphous carbon (AmC) and SiC. A composition ratio parameter X was defined to specify the number ratio of the two types of dust particles. In O-rich AGB stars, X = silicate/(silicate + Al2O3); in C-rich AGB stars, X = AmC/(AmC + SiC). They found that this assumption can well describe the properties of the envelopes of AGB stars in general. In many previous studies of radiative transfer models of AGB stars, the dust composition ratio X is fixed. For example, Sargent et al. (2011) used 100% silicate for O-rich AGB stars and Srinivasan et al. (2011) used a mixture consisting of 90% AmC and 10% SiC for C-rich AGB stars. Groenewegen (2006) introduced three dust composition ratios (X = 100%, 40% and 0%) for O-rich and two ratios (X = 100% and 85%) for C-rich envelopes. In this work, to save time and for completeness, we fixed the dust ratio to 100% silicate around O-rich AGB stars and adopted five dust composition ratios of AmC and SiC ranging from 100% to 60% for C-rich stars. The optical properties of silicate grains were taken from Ossenkopf et al. (1992) and the porous corundum Al2O3 from Begemann et al. (1997). While the optical properties of porous corundum from Begemann et al. (1997) only cover a wavelength range redward of 7.8 μm, the refraction indices are assumed to be constant at shorter wavelengths, with a value equal to the corresponding end point. We can see from Fig. 2 of Begemann et al. (1997) that the refractive index from Koike et al. (1995) and Chu et al. (1988) at wavelengths shorter than 7.8 μm is roughly constant. The optical properties of AmC were taken from Suh (2000) and SiC from Pegourie (1988). The grain-size distribution was modeled as n(a) ∝ a−q for amin < a < amax (MRN distribution, Mathis et al. 1977) with a power-law index q = 3.5, amin = 0.005 μm and amax = 0.25 μm.
In DUSTY models, Tin is specified directly instead of the inner radius. We calculated models with Tin ranging from 600–1800 K for C-rich and 600–1400 K for O-rich AGB stars with increments of 200 K. Dust grains cannot form at temperatures higher than the sublimation temperature, which is approximately 1400 K (1800 K) for silicate (graphite grains) (Posch et al. 2007; Speck et al. 2009). The ranges of Tin are roughly consistent with that of models in Sargent et al. (2011) and Srinivasan et al. (2011). We assumed that the power of the density profile α = 2 for the circumstellar envelopes, which is typical for steady circumstellar winds. When α = 2, we find that the variance of the relative thickness of the shell from 102 to 105 does not have a significant impact on the mid-infrared colors at WISE wavelengths. Thus, the relative thickness was fixed at 4 × 10³. The optical depth τ at 0.55 μm ranges from 10-2 to 102 and is sampled in logarithmic space, with a finer stepsize at the highest optical depths to ensure an even distribution of models in color–color space. Finally, we calculated 3 (7) values of Teff, 5 (1) values of X, 7 (5) values of Tin, and 29 (29) values of τ0.55 for C-rich (O-rich) AGB stars. This gives a total of 3045 and 1015 models for C-rich and O-rich AGB stars, respectively. The ranges of model parameters are listed in Table 1.
Given each set of parameters of Teff, X, Tin,
rout/rin,
α,
τλ, DUSTY computes the
emerging SED (from 0.1 μm to 3600 μm) from the envelope. The SED consists of three
components: attenuated stellar radiation, scattered radiation, and dust emission. The
emerging SED can be convolved with WISE photon-counting relative system response (RSR)
curves, λR(λ) (Jarrett et al. 2011), to simulate the WISE photometry:
 (1)Here bn is the width (in units
of μm) of
each WISE band. Fλn are the fluxes at
the magnitude zero point in the four bands. Since WISE saturates on Vega, the magnitude
zero points are based on fluxes of fainter stars calibrated to the Vega system. We applied
2MASS relative spectral response curves derived by Cohen et
al. (2003) to obtain the simulated 2MASS magnitudes. This procedure was used to
simulate the WISE and 2MASS magnitudes for each model template.
(1)Here bn is the width (in units
of μm) of
each WISE band. Fλn are the fluxes at
the magnitude zero point in the four bands. Since WISE saturates on Vega, the magnitude
zero points are based on fluxes of fainter stars calibrated to the Vega system. We applied
2MASS relative spectral response curves derived by Cohen et
al. (2003) to obtain the simulated 2MASS magnitudes. This procedure was used to
simulate the WISE and 2MASS magnitudes for each model template.
Parameter range for model templates.
2.3. WISE photometry and calibration method
We applied the WISE RSRs to the ISO spectra to simulate WISE photometry for these ISO
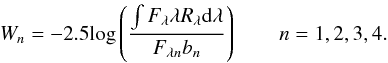
objects. Figure 1 compares the observed WISE
magnitudes with those simulated from the ISO spectra. In the figure, the 66 O-rich stars
are designated as plus signs and the 44 C-rich AGB stars as triangles. Dashed lines
indicate equality between the x- and y-axis values. Solid lines in W3 and W4 panels are the best-fit
relations given by 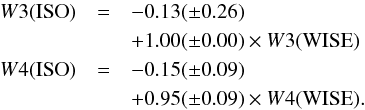 (2)We
fit the line equation for W3 with a fixed unity slope to safely extrapolate the
relation to fainter magnitude. The correlation between ISO and WISE is quite good in the
W3 and
W4 bands,
except that a turning point exists in the W3 band. The correlation only holds for objects
fainter than −2 mag in
W3. That is
the reason why we excluded sources with W3 brighter than –2 when we assembled our WISE AGB
sample in Sect. 2.1. As ISO and WISE observations were taken at different epochs and AGB
stars are variable objects even in infrared bands, part of the spread in the
W3 and
W4 equation
is due to the variability of AGB stars. We also compared WISE W3 and W4 bands with IRAS 12
μm and 25
μm data and
found they agree well. However, no obvious correlation is observed between WISE data and
ISO observations in the W1 and W2 bands.
(2)We
fit the line equation for W3 with a fixed unity slope to safely extrapolate the
relation to fainter magnitude. The correlation between ISO and WISE is quite good in the
W3 and
W4 bands,
except that a turning point exists in the W3 band. The correlation only holds for objects
fainter than −2 mag in
W3. That is
the reason why we excluded sources with W3 brighter than –2 when we assembled our WISE AGB
sample in Sect. 2.1. As ISO and WISE observations were taken at different epochs and AGB
stars are variable objects even in infrared bands, part of the spread in the
W3 and
W4 equation
is due to the variability of AGB stars. We also compared WISE W3 and W4 bands with IRAS 12
μm and 25
μm data and
found they agree well. However, no obvious correlation is observed between WISE data and
ISO observations in the W1 and W2 bands.
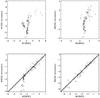 |
Fig. 1 Comparison between the WISE magnitudes and the ISO spectral observations of AGB stars in WISE W1–W4 bands. Pluses are O-rich and triangles are C-rich AGB stars. Dashed lines indicate equality between the x- and y-axis values, and solid lines are the best-fit linear relations where applicable. |
It is mentioned in the WISE Explanatory Supplement documentation of the All-Sky Data Release that bright sources will saturate WISE detectors1. The saturation limits are 8.1, 6.7, 3.8, and −0.4 mag for the W1–W4 bands, respectively. For saturated objects, WISE fits the PSF to the unsaturated pixels on the images to recover the saturatured pixels and yield photometry for these objects (we call this PSF-fit photometry). The bright source photometry limits for the WISE 4 bands are 2, 1.5, −3, and −4 mag. When they are brighter than this limit, all the pixels are saturatured and no unsaturated pixels are available to fit to the PSF. Therefore the PSF-fit photometry is quite unreliable for sources brighter than the photometry limit. Because AGB stars typically are bright IR objects, most of our AGB samples are brighter than the saturation limits, and therefore only PSF-fit photometry is available. This comparison suggests that the PSF-fit photometry can be directly calibrated to the ISO synthetic photometry in the W3 and W4 bands and becomes quite unreliable for almost all the considered bright ISO AGB stars in W1 and W2 bands. Our ISO samples are confined to a relatively bright synthetic W3 magnitude range of W3 < 0.5. To facilitate our calibration down to the WISE saturation limit of 3.8 mag, we assumed that the good correlation between the PSF-fit and ISO synthetic W3 photometry can be extrapolated. To ensure a reliable extrapolation, we adopted the fit with unity slope (Eq. (2)). To compensate for the loss of the W1 and W2 band data for bright objects like our AGB stars, we developed a calibration strategy based on the use of the DUSTY model template introduced in Sect. 2.2.
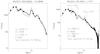 |
Fig. 2 Comparison between photometric/spectroscopic observations and DUSTY best-fit models for AGB stars. The left panel is for a selected O-rich star and the right panel for a C-rich star. The solid lines are ISO SWS spectra in the range between 2.5 μm and 45 μm. The diamonds represent 2MASS J, H, and Ks-band fluxes and ISO synthetic photometry for W1, W2, W3, and W4. The dotted lines are the best-fit models described in the text. The molecular features discussed in the text are marked. |
To find the best-fit model to each source, we adopted the following fitting procedure: the goodness of fit was measured by the overall offset between observed and model magnitudes. For each object, each set of model magnitudes was shifted together to obtain the smallest offset from the observed magnitudes. The overall shift is then the average of the differences in the five bands. We assumed that an overall shift smaller than 0.4 mag consistutes a good fit. For comparison, the average root mean square observational uncertainties at these five bands are 0.165 and 0.198 mag for O-rich and C-rich AGB, respectively.
We obtained the W3 and W4 magnitudes of the ISO AGB sources by convolving ISO spectra with proper filter-response curves. Figure 2 shows the ISO spectra as a solid line and the associated 2MASS J, H, Ks fluxes (squares) for one AGB star of each type. The dotted lines are the fitted model SEDs. The models fit the observations well in the bands of interest. The best-fit model parameters and deviation from observations are displayed in each panel. We note that the best-fit model does not fit the dust resonance features (such as 9.7 μm and 18 μm silicate features) very well, since we only have two synthetic photometry points to sample this part of the SED. There are some other wavelength regions where model spectra do not match the observations, such as the absorption feature at about 5 μm in the spectrum of the selected C-rich AGB star, which is absent from the model SED. The absorption feature at about 5 μm may be the molecular features of C3 at 5.1 μm and/or CO at 4.6 μm (Gautschy-Loidl et al. 2004). The carbon-star spectrum shown in Fig. 2 also has deep features at ~3 μm and ~14 μm, which are caused by HCN+C2H2 (Gautschy-Loidl et al. 2004). Strong C2H2 features have been observed in carbon stars in nearby galaxies; in the Milky Way’s high metallicity it is expected that there is a larger contribution from HCN to these features (Matsuura et al. 2006). More complicated DUSTY models with additional dust and molecular species may improve our fits. However, this requires significant efforts on choosing dust compositions for models and beyond the scope of the current work. The difference of the W2 magnitude of this C-rich AGB star between observation and model is 0.11 mag. According to our analysis, this level of uncertainty does not significantly affect our results and our conclusions are still valid. We expect that the model spectra and dust properties can be better constrained with more photometry points in some narrow-band filters that trace the molecular and dust features.
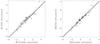 |
Fig. 3 Comparison between the ISO simulation magnitudes and the simulated magnitudes from the model for AGB stars in the WISE W1 and W2 bands. Pluses are O-rich and triangles are C-rich AGB stars. Dashed lines indicate equality between the x- and y-axis values. |
In total, 45 O-rich AGB and 28 C-rich AGB stars with ISO spectra were successfully
modeled. The comparison of W1 and W2 magnitudes between ISO observations and the
DUSTY models are shown in Fig. 3. Dashed lines
indicate equality between the x- and y-axis values. The data points are fitted with a
linear equation as 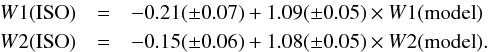 (3)The
correlations of both O-rich and C-rich AGB stars (represented by pluses and triangles,
respectively) are very close to the one-to-one equation, which suggests that the DUSTY
models agree well with the ISO observations despite the degeneracy of some model
parameters and no correction for interstellar extinction. The slight deviation from ISO
synthetic photomety may be caused by the molecular features, which are absent in the model
spectra.
(3)The
correlations of both O-rich and C-rich AGB stars (represented by pluses and triangles,
respectively) are very close to the one-to-one equation, which suggests that the DUSTY
models agree well with the ISO observations despite the degeneracy of some model
parameters and no correction for interstellar extinction. The slight deviation from ISO
synthetic photomety may be caused by the molecular features, which are absent in the model
spectra.
Based on the above results, we calibrated our WISE AGB sample in five steps. First, we calibrated WISE W3 and W4 PSF-fit photometry to ISO synthetic photometry by using Eq. (2). Second, we fit the calibrated W3 and W4 and the 2MASS J, H, and Ks-band magnitudes and determined the best DUSTY model for each WISE AGB star. Third, we compared the model W1 and W2 magnitudes with the observed ones for our whole sample of AGB stars and identified the magnitude ranges in which good linear correlations hold. Fourth, we assumed that the ISO simulated W1 and W2 magnitudes are reliable as a whole to derive empirical formulas for calibrating the observed W1 and W2 magnitudes to those of the DUSTY model and then to those simulated by ISO. Finally, we applied the obtained calibration formulas to the observed W1 and W2 magnitudes of the objects in the good-correlation magnitude ranges. As a result, 1659 of 2203 O-rich and 835 of 958 C-rich WISE AGB stars meet our good-fit criteria. In total, we calibrated the W1/W2 magnitudes of 2390/2021 AGB stars. The detailed calibration solution is discussed in Sect. 3.1. We note that about one fourth (544) of the O-rich AGB stars cannot be fitted by our model grid. We explored the model grid from Sargent et al. (2011) and found that the situation is not improved. Most of the objects without best-fits tend to have higher W3 − W4 colors than fitted ones. Some even have an extreme W3−W4 color with strong deviations from the main distribution of O-rich AGB stars in the color−color diagram and seem to be misclassified as AGB stars or have some extreme properties that we do not know yet. We explored many possible model parameter ranges and did not find a significant improvement.
3. Results
3.1. WISE calibration solution
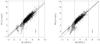 |
Fig. 4 Comparison between W1 and W2 magnitudes from the best-fit models and WISE observations. Vertical dashed lines delineate the magnitude limits between which AGB stars are selected to derive the coefficients of calibration equations. Solid lines are the linear least-squares fits to the data points between lower limit and the WISE saturation limit. Dotted lines are the lines of the unit slope for reference. The error bars in the right corner indicate the median uncertainties in model magnitudes, including that caused by variability. |
We show the comparison between the W1 and W2 model magnitudes and the WISE observation magnitudes in Fig. 4. A linear relationship seems to exist between the model values and the observations for most sources at the faint end, although these sources are all brighter than the nominal saturation limits. Only a small fraction of the sources at the bright end do not follow the relationships. The features at the bright end are similar to those in Fig. 1 when comparing ISO simulation magnitudes with WISE. This also supports the consistency between ISO spectra and DUSTY models. The faint end vertical dashed lines indicate the WISE saturation limits (8 and 6.7 mag for W1 and W2). Vertical dashed lines at the bright end (3 and 2.2 mag for W1 and W2, respectively) indicate the criteria that are visually determined to exclude sources that disagree in the linear relationship. The bright useful limit is consistent with the WISE photometry limit mentioned in Sect. 2.3. Twenty data points in the W1 and 32 data points in the W2 panels, which significantly deviate from the linear distribution, were excluded. The correlation coefficients of the data points selected by the criteria and WISE saturation limit are 0.898 and 0.910 in the W1 and W2 bands.
To acquire a more realistic relationship between model W1 and W2 and WISE W1 and W2, the uncertainties in the y-axis of the model synthetic magnitudes that are caused by variability of AGB stars need to be specified. We estimated the uncertainties caused by variability with the following three steps: first, we calculated a “typical” model SED with typical model parameters (Teff = 3000 K, X = 1, Tin = 1000 K and τ0.55 = 10). Then, for each band of J, H, Ks, W3, and W4 of this “typical” model SED, we assumed a sinusoidal light curve with different amplitude and different phase. Smith et al. (2002) suggested that the variation amplitude decreases with increasing wavelength. Since the variability amplitude of the semiregular variables (SRVs) is typically 0.4–0.8 mag and that of miras in the OGLE-III (Opitcal Graviational Lensing Experiment; Soszyński et al. 2013) dataset are higher than 1 mag in the I band, we assumed the typical amplitude of variation as 0.7, 0.7, 0.7, 0.4, and 0.4 mag for J, H, Ks, W3, and W4 bands, respectively. We sampled each light curve at a random phase to generate a new SED. Finally, we simulated the new SED and compared the new W1 and W2 with the primary W1 and W2 of the “typical” model SED. We repeated the second and third steps to find the W1 and W2 model uncertainties, which are 0.522 and 0.480 mag.
To determine the linear relation in a more robust way, we used median fitting. The data
points were divided into several bins with 150 objects in each bin along the
x-axis. For
each bin we computed the median x- and y-values and used the median absolute deviation
from the median (MADM) to estimate the spread in x- and y-values. Then we fit a
line through these new binned data points. The results of the linear equation using median
fitting are as follows: 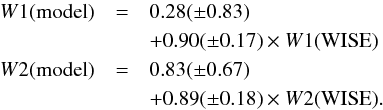 (4)The
linear relations are plotted as solid lines in the Fig. 4. The dotted lines of the unit slope are plotted for reference. The nonunity
slope of linear relationships indicate that the offsets of the WISE observations are
magnitude-dependent. Although several data points near the bright criteria do not follow
the linear relationship, the fitted linear relations are valid for most data points. The
dispersion may be caused by the variability of AGB stars and uncertainties in models. The
relation between DUSTY models and ISO observations as described in Eq. (3) yields our
final calibration formulas:
(4)The
linear relations are plotted as solid lines in the Fig. 4. The dotted lines of the unit slope are plotted for reference. The nonunity
slope of linear relationships indicate that the offsets of the WISE observations are
magnitude-dependent. Although several data points near the bright criteria do not follow
the linear relationship, the fitted linear relations are valid for most data points. The
dispersion may be caused by the variability of AGB stars and uncertainties in models. The
relation between DUSTY models and ISO observations as described in Eq. (3) yields our
final calibration formulas: 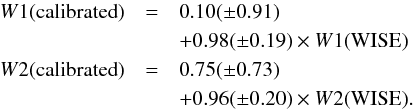 (5)The
empirical calibration formulas are valid only in the ranges of 3–8 mag for W1 and 2.2–6.7 mag for
W2. In our
AGB star sample, the W1 and W2 magnitudes of 2390 and 2021 AGB stars are
located in these ranges. The median of W(model)–W(PSF) is −0.024 and 0.557 mag for W1 and W2. It can also be deduced
from Eq. (5) that WISE PSF-fit photometry in general slightly underestimates the
W1 flux and
overestimates the W2 flux.
(5)The
empirical calibration formulas are valid only in the ranges of 3–8 mag for W1 and 2.2–6.7 mag for
W2. In our
AGB star sample, the W1 and W2 magnitudes of 2390 and 2021 AGB stars are
located in these ranges. The median of W(model)–W(PSF) is −0.024 and 0.557 mag for W1 and W2. It can also be deduced
from Eq. (5) that WISE PSF-fit photometry in general slightly underestimates the
W1 flux and
overestimates the W2 flux.
Several effects may contribute to the magnitude-dependent offsets. First, AGB stars have extended profiles because of their dusty mass-loss winds. The extended profile probably has an exaggerated effect on the PSF magnitudes that are computed using the unsaturated outer part of a saturated star image. Since brighter stars are typically more extended, this effect might contribute to the nonunity slope. Second, variability of AGB stars will introduce uncertainties in model simulation and dispersion in Fig. 4, which will reduce the slope. Finally, the flux-dependent shape of the PSF of the WISE detector in the saturated regime might be another contributor to the bright star flux biases, which are discussed in the section on photometric bias in the WISE Explanatory Supplement documentation of the All-Sky Data Release.
Since the uncertainties caused by variability of the y-axis are much larger than the uncertainties of observations in the x-axis, variability has a significant influence on the relation in Fig. 4. As we mentioned in Sect. 2.3, the molecular absorbtion feature in the W1 and W2 bands may be an important reason for the DUSTY model deviation from ISO, some molecules such as CO also have features in the near-infrared band. It is hard to quantify the effect of the molecular feature on the model simulation. However, changes caused by the molecular feature (~0.1 mag in the W1 and W2 bands) to the infrared SED are much smaller than the change caused by variability (~0.5 mag in the W1 and W2 bands). Since we have taken variability uncertainties into consideration, adding uncertainties caused by molecular features will not make a noticeable difference to the current results.
3.2. Separation between C-rich and O-rich AGB
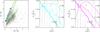 |
Fig. 5 Left panel: WISE color–color diagram that can be used to distinguish O-rich and C-rich AGB stars. Both the W1 − W2 color and W3 − W4 color are computed from the calibrated photometry. Pluses are O-rich stars, while triangles are C-rich stars. The dashed line is calculated to most effectively separate the two types of AGB stars. The solid green curves (left: O-rich, right: C-rich) are a series of models with different optical depths and typical values for the other 3 parameter values. The dash-dotted line is a series of blackbodies for reference. The four blue squares from bottom to top are blackbodies with temperatures of 3500, 2500, 1500, and 500 K, respectively. The middle and right panels show the DUSTY model SEDs with optical depth τ0.55 = 0.01, 1.25, and 80 for O-rich AGB and C-rich AGB, respectively. The dotted curves are the WISE W1 − W4 band relative spectral response functions. The simulated colors of these four models are designated as thick squares in the left panel. |
We plot the W1 −
W2 versus W3 − W4 color–color diagram of our
calibrated WISE sample in Fig. 5. It can be seen that
the two types of AGB stars are located in different regions in the figure and can be well
distinguished in the WISE color–color diagram. A red solid line is plotted to effectively
separate the two types of AGB stars. The straight lines successfully separate 87.1% of the
O-rich AGB stars and 85.7% of the C-rich AGB stars. We computed the separation line by
varying the slope and intercept until the product of the two separation fractions were
minimum. This line function is  (6)It can be seen from
Figure 5 that some data points lie far from the main distribution of AGB stars and show
extremely high W3 −
W4 colors. They are the sample of objects whose SEDs
cannot be successfully fit by our DUSTY model grids.
(6)It can be seen from
Figure 5 that some data points lie far from the main distribution of AGB stars and show
extremely high W3 −
W4 colors. They are the sample of objects whose SEDs
cannot be successfully fit by our DUSTY model grids.
To probe the physical origin of this division, we calculated two sequences of DUSTY models by varying the optical depth while keeping the other three parameters fixed (Teff = 3000 K, X = 1 and Tin = 1000 K) for both O-rich and C-rich AGB stars. The optical depth τ0.55 ranges from 0.01 to 100. The resulting tracks are also plotted as green curves in the left panel of Fig. 5. In general, increasing the optical depth, which also indicates a decrease in the dust temperature, causes the data point to move diagonally from left bottom to upper right in the figure. O-rich models differ significantly from C-rich models in that the W1 − W2 color increases much more slowly than W3 − W4 does with increasing optical depth. Therefore, the distribution of O-rich models moves almost horizontally at the low W1 − W2 end. The only difference between these two sequences of models is the dust composition. We also plot the blackbody curve for temperatures from 500 K to 3500 K as the dash-dotted line in the figure. The distribution of carbon stars roughly follows the trend of the blackbody curve, but with slightly bluer W1 − W2 or redder W3 − W4 colors than the latter.
The middle and right panels of Fig. 5 show the model SEDs with optical depth equal to 0.01, 1.25, and 40 for O-rich and C-rich AGB stars (middle panel for O-rich and right for C-rich) and WISE W1 − W4 response functions. The simulated WISE colors of these four models are indicated as squares in the left panel of Fig. 5. The SED of the C-rich star model with an optical depth of 0.01 almost overlaps that of the O-rich model with the same optical depth, since both of them are not affected significantly by dust and are essentially the spectrum of the central star. In contrast, SEDs of the models with an optical depth of 1.25 and 40 are different between the two AGB types, although the SEDs are normalized to the bolometric luminosities of the stars. When τ = 1.25, the O-rich star model shows negligible emission at the shorter wavelengths and thus is still dominated by the central star emission, while the C-rich star model has begun to be dominated by dust emission at these wavelengths. Conversely, O-rich AGB stars show stronger dust emission at longer wavelengths than C-rich AGB stars. This difference arises because O-rich dust species have much less efficient absorption at shorter wavelengths but more efficient absorption at longer wavelengths than C-rich dust species. This explains that the W1 − W2 colors of O-rich model AGB stars are not sensitive to the increase of optical depth in the not very optically thick cases while their W3 − W4 colors redden faster than C-rich AGB stars. When the circumstellar envelope becomes very optically thick (with τ = 40), the O-rich AGB star model still has bluer W1 − W2 and redder W3 − W4 colors than the C-rich AGB star model. This is because of the more efficient absorption at longer wavelengths and perhaps also because of the self-absorption feature at 9.8 μm. The C-rich AGB stars are located closer to the blackbody line because the C-rich dust species have a relatively smooth opacity profile.
3.3. Model parameters
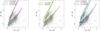 |
Fig. 6 WISE color–color diagram overlaid with models with different parameters. Models with the three parameters Teff, X, and Tin are shown in different panels from left to right. Solid lines are the fiducial model series as shown in Fig. 5. In each panel, the left set of tracks are models for C-rich stars and the right tracks plot O-rich models. |
From Fig. 5, it can be seen that the trend of our WISE AGB sample from left bottom to upper right in the color–color diagram is predominantly caused by changes in optical depth. To analyze the effects of the other three model parameters (Teff, Tin and X) on the mid-infrared colors, we took the optical depth tracks in Fig. 5 as standard model tracks and constructed new tracks for various values of the other three parameters. The three panels of Fig. 6 compare the model tracks produced by varying one of the three other model parameters. Note that not all values of X might be physical. The maximum fractional abundance of SiC in the dust depends on the metallicity as well as on the fraction of Si that condenses into dust. The AmC-to-SiC ratio is also controlled by the dust condensation sequence; depending on whether C or SiC condenses first (see, e.g., Sect. 5 in Leisenring et al. (2008) and references therein). These model curves are only used to show the range of variation in our models that is caused by changes in the model parameters. Solid lines are the standard model tracks as shown in Fig. 5.
In the left panel of Fig. 6, it can be seen that the change of Teff mainly affects the optically thin objects. This is because the NIR SEDs of optically thin AGB stars are dominated by the central star’s radiation. In the middle panel of Fig. 6, the change of the dust composition ratio X mainly affects the IR colors of C-rich AGB star models while its effects are quite weak on O-rich AGB star models. This may be because the difference between the extinction curve of the two assumed dust components is steeper in C-rich AGB stars than that in O-rich AGB stars. In the right panel of Fig. 6, models with higher Tin have fainter (i.e. bluer) W3 − W4 and W1 − W2 colors, which is consistent with the behavior of the blackbody. The variety of these physical parameters in AGB circumstellar envelopes contributes significantly to the data scatter in the WISE color–color diagram.
3.4. Implications of the number statistics
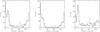 |
Fig. 7 Longtitude distribution of our calibrated WISE AGB stars. The left panel shows all stars in the sample, while the middle panel shows objects with τ0.55 > 10 and the right panel shows stars with τ0.55 < 10. O-rich AGB stars are solid lines and C-rich stars are plotted as dashed lines. |
Because this is compilation of different works, it is hard to quantitatively estimate the completeness of our WISE AGB sample. However, we can determine the completeness from the spatial distribution of the sources. Most of the WISE AGB stars are located at the low Galactic latitude region, as expected. The longitude distributions are shown in Fig. 7. The left panel shows the whole sample, while the right two panels show sources with optical depth τ0.55 > 10 and τ0.55 < 10, respectively. It is obvious that more O-rich AGB stars (solid) concentrate toward the direction of the Galactic center, while C-rich AGB stars (dashed) are distributed more evenly along the Galactic longitude. The different longitude distributions of O-rich and C-rich AGB stars are consistent with previous works. For example, Le Bertre et al. (2003) found that C-rich AGB stars are located preferentially in the exterior of our Galaxy and O-rich stars tend to reside in the interior of our Galaxy. The Galactic segregation of these two types of AGB stars is usually interpreted as an effect of the metallicity during the formation of C-rich AGB stars. Stellar evolution models of AGB stars show that O-rich AGB stars can evolve into C-rich AGB stars more rapidly at lower metallicity (Le Bertre et al. 2003). Thus the metallicity gradient in our Galaxy can cause the different longtitude distributions of O-rich and C-rich AGB stars. The consistent spatial distributions between the our sample and other works suggests that the sample might represent a population of AGB stars in the solar neighborhood. This may be because the catalog is built from sources selected randomly in different works.
The middle panel of Fig. 7 is the longitude distribution of AGB stars with τ0.55 > 10. Very few high optical depth O-rich AGB stars locate in the direction opposed to the Galactic center. This deficiency of high optical depth object is obvious from comparing the middle panel and the right panel of Fig. 7. We can rule out the possibility that the differing Galactic interstellar extinction along different lines of sight could lead to this trend because no significant difference is present in the longitude distribution of low and high optical depth C-rich AGB stars. The metallcity gradient in our Galaxy may again be a natural explanation because O-rich AGB stars in the exterior of our Galaxy have lower metallicty and will evolve into C-rich AGB stars at earlier evolution times. These O-rich AGB stars may have a relatively lower amount of dust in the circumstellar envelopes and lower optical depth.
4. Summary
We reported our findings on AGB star colors in the WISE bands. We found that the WISE W1 and W2 magnitudes of AGB stars do not agree with the spectroscopic measurements from ISO when we compared our sample of ISO simulated W1 − W4 magnitudes with WISE observations, which we attribute to the residual bias in the PSF-fit photometry of saturated objects in these two bands. The WISE saturated W3 and W4 magnitudes are directly calibrated based on ISO synthetic photometry. To calibrate the WISE W1 and W2 bands, we resorted to ISO spectra of a subsample of our AGB stars and proved that the radiation transfer code DUSTY can be used to reproduce unbiased W1 and W2 magnitudes of bright stars. Using DUSTY, we successfully developed a calibration method for the observed WISE W1 and W2 bands to lift the residual bias of the PSF-fit photometry. The calibration procedure revealed that WISE may in general have underestimated W1 flux and overestimated W2 flux, and these deviations seem to be magnitude-dependent.
Combining the model-calibrated W1 and W2 data with the directly calibrated WISE W3 and W4 magnitudes, we analyzed the W1 − W2 vs. W3 − W4 color–color diagram and found that the two main types of AGB stars, O-rich AGB and C-rich AGB, can be effectively distinguished by their WISE colors. The division is mainly caused by the different extinction efficiencies between silicate-type and carbonaceous grains. The spatial distribution of the AGB sample is consistent with previous work. We also found that O-rich AGB stars with an opaque circumstellar envelope are much rarer toward the anti-Galactic center direction than C-rich AGB stars, which we attribute to the metallicity gradient of our Galaxy.
WISE Explanatory Supplement documentation for All-Sky Data Release http://wise2.ipac.caltech.edu/docs/release/allsky/expsup/
Acknowledgments
We thank the referee for thoughtful comments and insightful suggestions, which significantly improved the quality of this paper. This publication makes use of data products from the Wide-field Infrared Survey Explorer, which is a joint project of the University of California, Los Angeles, and the Jet Propulsion Laboratory/California Institute of Technology, funded by the National Aeronautics and Space Administration, and the Two Micron All Sky Survey, which is a joint project of the University of Massachusetts and the Infrared Processing and Analysis Center/California Institute of Technology, funded by the National Aeronautics and Space Administration and the National Science Foundation. We are grateful to Martin Cohen, who provided the Vega spectrum to check our magnitude simulation process, and to Edward Wright, who gave us very useful advice about the origin of the magnitude-dependent offset of WISE photometry in the saturated regime. This work is supported by China Ministry of Science and Technology under State Key Development Program for Basic Research (2012CB821800), the National Natural Science Foundation of China (NSFC, Nos. 11173056, 11225315 and 11320101002), Chinese Universities Scientific Fund (CUSF) and Specialized Research Fund for the Doctoral Program of Higher Education (SRFDP, No. 20123402110037).
References
- Aringer, B., Girardi, L., Nowotny, W., Marigo, P., & Lederer, M. T. 2009, A&A, 503, 913 [NASA ADS] [CrossRef] [EDP Sciences] [Google Scholar]
- Begemann, B., Dorschner, J., Henning, T., et al. 1997, ApJ, 476, 199 [NASA ADS] [CrossRef] [Google Scholar]
- Bloecker, T. 1995, A&A, 297, 727 [Google Scholar]
- Boyer, M. L., Srinivasan, S., Riebel, D., et al. 2012, ApJ, 748, 40 [NASA ADS] [CrossRef] [Google Scholar]
- Chu, Y. T., Bates, J. B., White, C. W., & Farlow, G. C. 1988, J. Appl. Phys., 64, 3727 [NASA ADS] [CrossRef] [Google Scholar]
- Cohen, M., Wheaton, W. A., & Megeath, S. T. 2003, AJ, 126, 1090 [NASA ADS] [CrossRef] [Google Scholar]
- Egan, M. P., Price, S. D., Kraemer, et al. 2003, Air Force Research Laboratory Technical Report AFRL-VS-TR-2003-1589 [Google Scholar]
- Gautschy-Loidl, R., Höfner, S., Jørgensen, U. G., & Hron, J. 2004, A&A, 422, 289 [NASA ADS] [CrossRef] [EDP Sciences] [Google Scholar]
- Groenewegen, M. A. T. 2006, A&A, 448, 181 [NASA ADS] [CrossRef] [EDP Sciences] [Google Scholar]
- Groenewegen, M. A. T. 2012, A&A, 543, A36 [NASA ADS] [CrossRef] [EDP Sciences] [Google Scholar]
- Habing, H. J. 1996, A&ARv, 7, 97 [NASA ADS] [CrossRef] [Google Scholar]
- Ivezic, Z., & Elitzur, M. 1997, MNRAS, 287, 799 [NASA ADS] [CrossRef] [Google Scholar]
- Jarrett, T. H., Cohen, M., Masci, F., et al. 2011, ApJ, 735, 112 [NASA ADS] [CrossRef] [Google Scholar]
- Javadi, A., van Loon, J. T., Khosroshahi, H., & Mirtorabi, M. T. 2013, MNRAS, 432, 2824 [NASA ADS] [CrossRef] [Google Scholar]
- Jura, M., & Kleinmann, S. G. 1989, ApJ, 341, 359 [NASA ADS] [CrossRef] [Google Scholar]
- Kessler, M. F., Steinz, J. A., Anderegg, M. E., et al. 1996, A&A, 315, L27 [NASA ADS] [Google Scholar]
- Koike, C., Yamamoto, T., Shibai, H., Kimura, S., & Suto, H. 1995, Icarus, 114, 203 [NASA ADS] [CrossRef] [Google Scholar]
- Kučinskas, A., Hauschildt, P. H., Ludwig, H.-G., et al. 2005, A&A, 442, 281 [NASA ADS] [CrossRef] [EDP Sciences] [Google Scholar]
- Le Bertre, T., Tanaka, M., Yamamura, I., & Murakami, H. 2003, A&A, 403, 943 [NASA ADS] [CrossRef] [EDP Sciences] [Google Scholar]
- Leisenring, J. M., Kemper, F., & Sloan, G. C. 2008, ApJ, 681, 1557 [NASA ADS] [CrossRef] [Google Scholar]
- Lewis, B. M., Eder, J., & Terzian, Y. 1990, ApJ, 362, 634 [NASA ADS] [CrossRef] [Google Scholar]
- Maldoni, M. M., Ireland, T. R., Smith, R. G., & Robinson, G. 2005, MNRAS, 362, 872 [NASA ADS] [CrossRef] [Google Scholar]
- Matsuura, M., Chesneau, O., Zijlstra, A. A., et al. 2006, ApJ, 646, L123 [NASA ADS] [CrossRef] [Google Scholar]
- Mathis, J. S., Rumpl, W., & Nordsieck, K. H. 1977, ApJ, 217, 425 [NASA ADS] [CrossRef] [Google Scholar]
- Murakami, H., Bock, J., Freund, M. M., et al. 1994, ApJ, 428, 354 [NASA ADS] [CrossRef] [Google Scholar]
- Neugebauer, G., Habing, H. J., van Duinen, R., et al. 1984, ApJ, 278, L1 [Google Scholar]
- Ossenkopf, V., Henning, T., & Mathis, J. S. 1992, A&A, 261, 567 [NASA ADS] [Google Scholar]
- Pegourie, B. 1988, A&A, 194, 335 [NASA ADS] [Google Scholar]
- Posch, T., Mutschke, H., Trieloff, M., & Henning, T. 2007, ApJ, 656, 615 [NASA ADS] [CrossRef] [Google Scholar]
- Riebel, D., Srinivasan, S., Sargent, B., & Meixner, M. 2012, ApJ, 753, 71 [NASA ADS] [CrossRef] [Google Scholar]
- Riechers, D., Balega, Y., Driebe, T., et al. 2004, A&A, 424, 165 [NASA ADS] [CrossRef] [EDP Sciences] [Google Scholar]
- Sargent, B. A., Srinivasan, S., & Meixner, M. 2011, ApJ, 728, 93 [NASA ADS] [CrossRef] [Google Scholar]
- Sloan, G. C., Kraemer, K. E., Price, S. D., & Shipman, R. F. 2003, ApJS, 147, 379 [NASA ADS] [CrossRef] [Google Scholar]
- Skrutskie, M. F., Cutri, R. M., Stiening, R., et al. 2006, AJ, 131, 1163 [NASA ADS] [CrossRef] [Google Scholar]
- Smith, B. J., Leisawitz, D., Castelaz, M. W., & Luttermoser, D. 2002, AJ, 123, 948 [NASA ADS] [CrossRef] [Google Scholar]
- Soszyński, I., Udalski, A., Szymański, M. K., et al. 2013, Acta Astron., 63, 21 [NASA ADS] [Google Scholar]
- Speck, A. K., Corman, A. B., Wakeman, K., Wheeler, C. H., & Thompson, G. 2009, ApJ, 691, 1202 [NASA ADS] [CrossRef] [Google Scholar]
- Srinivasan, S., Sargent, B. A., & Meixner, M. 2011, A&A, 532, A54 [NASA ADS] [CrossRef] [EDP Sciences] [Google Scholar]
- Steffen, M., Szczerba, R., & Schoenberner, D. 1998, A&A, 337, 149 [NASA ADS] [Google Scholar]
- Suh, K.-W. 1999, MNRAS, 304, 389 [NASA ADS] [CrossRef] [Google Scholar]
- Suh, K.-W. 2000, MNRAS, 315, 740 [NASA ADS] [CrossRef] [Google Scholar]
- Suh, K.-W., & Kim, H.-Y. 2002, A&A, 391, 665 [NASA ADS] [CrossRef] [EDP Sciences] [Google Scholar]
- Suh, K.-W., & Kwon, Y.-J. 2009, J. Korean Astron. Soc., 42, 81 [NASA ADS] [CrossRef] [Google Scholar]
- Suh, K.-W., & Kwon, Y.-J. 2011, MNRAS, 417, 3047 (Suh11) [NASA ADS] [CrossRef] [Google Scholar]
- Werner, M. W., Roellig, T. L., Low, F. J., et al. 2004, ApJS, 154, 1 [Google Scholar]
- Wright, E. L., Eisenhardt, P. R. M., Mainzer, A. K., et al. 2010, AJ, 140, 1868 [NASA ADS] [CrossRef] [Google Scholar]
All Tables
All Figures
|
Fig. 1 Comparison between the WISE magnitudes and the ISO spectral observations of AGB stars in WISE W1–W4 bands. Pluses are O-rich and triangles are C-rich AGB stars. Dashed lines indicate equality between the x- and y-axis values, and solid lines are the best-fit linear relations where applicable. |
| In the text | |
|
Fig. 2 Comparison between photometric/spectroscopic observations and DUSTY best-fit models for AGB stars. The left panel is for a selected O-rich star and the right panel for a C-rich star. The solid lines are ISO SWS spectra in the range between 2.5 μm and 45 μm. The diamonds represent 2MASS J, H, and Ks-band fluxes and ISO synthetic photometry for W1, W2, W3, and W4. The dotted lines are the best-fit models described in the text. The molecular features discussed in the text are marked. |
| In the text | |
|
Fig. 3 Comparison between the ISO simulation magnitudes and the simulated magnitudes from the model for AGB stars in the WISE W1 and W2 bands. Pluses are O-rich and triangles are C-rich AGB stars. Dashed lines indicate equality between the x- and y-axis values. |
| In the text | |
|
Fig. 4 Comparison between W1 and W2 magnitudes from the best-fit models and WISE observations. Vertical dashed lines delineate the magnitude limits between which AGB stars are selected to derive the coefficients of calibration equations. Solid lines are the linear least-squares fits to the data points between lower limit and the WISE saturation limit. Dotted lines are the lines of the unit slope for reference. The error bars in the right corner indicate the median uncertainties in model magnitudes, including that caused by variability. |
| In the text | |
|
Fig. 5 Left panel: WISE color–color diagram that can be used to distinguish O-rich and C-rich AGB stars. Both the W1 − W2 color and W3 − W4 color are computed from the calibrated photometry. Pluses are O-rich stars, while triangles are C-rich stars. The dashed line is calculated to most effectively separate the two types of AGB stars. The solid green curves (left: O-rich, right: C-rich) are a series of models with different optical depths and typical values for the other 3 parameter values. The dash-dotted line is a series of blackbodies for reference. The four blue squares from bottom to top are blackbodies with temperatures of 3500, 2500, 1500, and 500 K, respectively. The middle and right panels show the DUSTY model SEDs with optical depth τ0.55 = 0.01, 1.25, and 80 for O-rich AGB and C-rich AGB, respectively. The dotted curves are the WISE W1 − W4 band relative spectral response functions. The simulated colors of these four models are designated as thick squares in the left panel. |
| In the text | |
|
Fig. 6 WISE color–color diagram overlaid with models with different parameters. Models with the three parameters Teff, X, and Tin are shown in different panels from left to right. Solid lines are the fiducial model series as shown in Fig. 5. In each panel, the left set of tracks are models for C-rich stars and the right tracks plot O-rich models. |
| In the text | |
|
Fig. 7 Longtitude distribution of our calibrated WISE AGB stars. The left panel shows all stars in the sample, while the middle panel shows objects with τ0.55 > 10 and the right panel shows stars with τ0.55 < 10. O-rich AGB stars are solid lines and C-rich stars are plotted as dashed lines. |
| In the text | |
Current usage metrics show cumulative count of Article Views (full-text article views including HTML views, PDF and ePub downloads, according to the available data) and Abstracts Views on Vision4Press platform.
Data correspond to usage on the plateform after 2015. The current usage metrics is available 48-96 hours after online publication and is updated daily on week days.
Initial download of the metrics may take a while.