Fig. 4
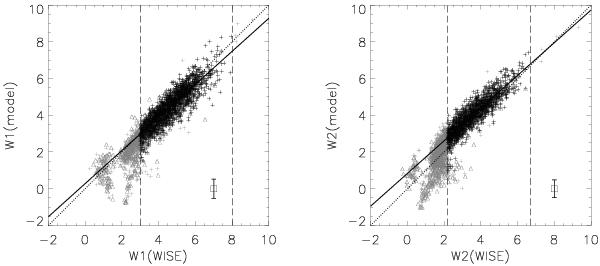
Comparison between W1 and W2 magnitudes from the best-fit models and WISE observations. Vertical dashed lines delineate the magnitude limits between which AGB stars are selected to derive the coefficients of calibration equations. Solid lines are the linear least-squares fits to the data points between lower limit and the WISE saturation limit. Dotted lines are the lines of the unit slope for reference. The error bars in the right corner indicate the median uncertainties in model magnitudes, including that caused by variability.
Current usage metrics show cumulative count of Article Views (full-text article views including HTML views, PDF and ePub downloads, according to the available data) and Abstracts Views on Vision4Press platform.
Data correspond to usage on the plateform after 2015. The current usage metrics is available 48-96 hours after online publication and is updated daily on week days.
Initial download of the metrics may take a while.