Fig. 12
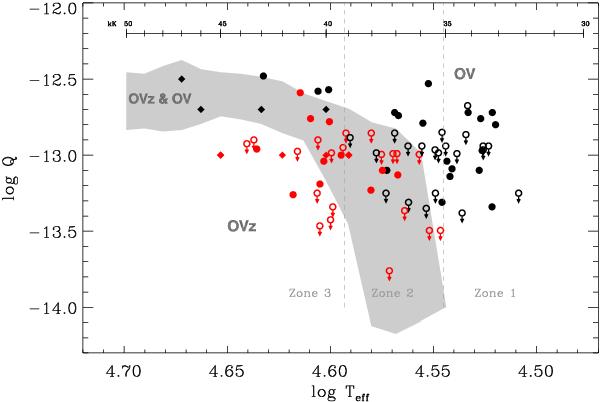
FASTWIND predictions for Vz behavior with log Q as a function of Teff, for models with 3.8 ≤ log g ≤ 4.2 dex, and 50 ≤ v sin i ≤ 300 km s-1, compared to the results from our analyses with the IACOB-GBAT. The shaded area indicates the region where we expect both O Vz and O V stars from our analysis (see text), whereas we expect only O V/O Vz stars above/below this area. Symbols as used in Fig. 7.
Current usage metrics show cumulative count of Article Views (full-text article views including HTML views, PDF and ePub downloads, according to the available data) and Abstracts Views on Vision4Press platform.
Data correspond to usage on the plateform after 2015. The current usage metrics is available 48-96 hours after online publication and is updated daily on week days.
Initial download of the metrics may take a while.