Fig. 3
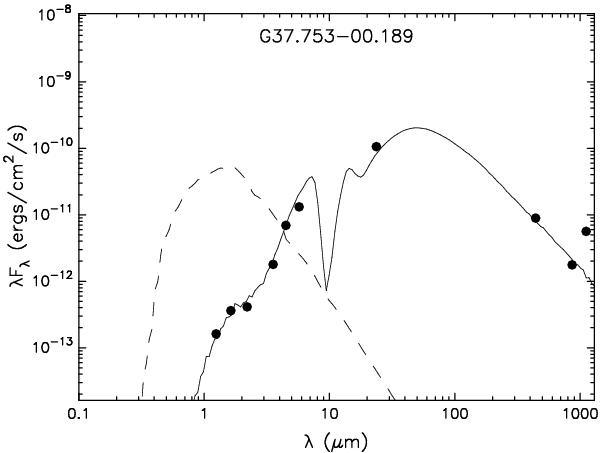
Fit to the spectral energy distribution of the first 6.7 GHz source in the sample. The fits for the remaining targets are presented in Fig. A.3. The filled circles show the input fluxes (Table B.2). The solid line shows the best fit and the gray lines show subsequent good fits. The dashed line shows the stellar photosphere corresponding to the central source in the best fitting model in the absence of circumstellar extinction and in the presence of interstellar extinction.
Current usage metrics show cumulative count of Article Views (full-text article views including HTML views, PDF and ePub downloads, according to the available data) and Abstracts Views on Vision4Press platform.
Data correspond to usage on the plateform after 2015. The current usage metrics is available 48-96 hours after online publication and is updated daily on week days.
Initial download of the metrics may take a while.