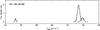
Fig. A.2
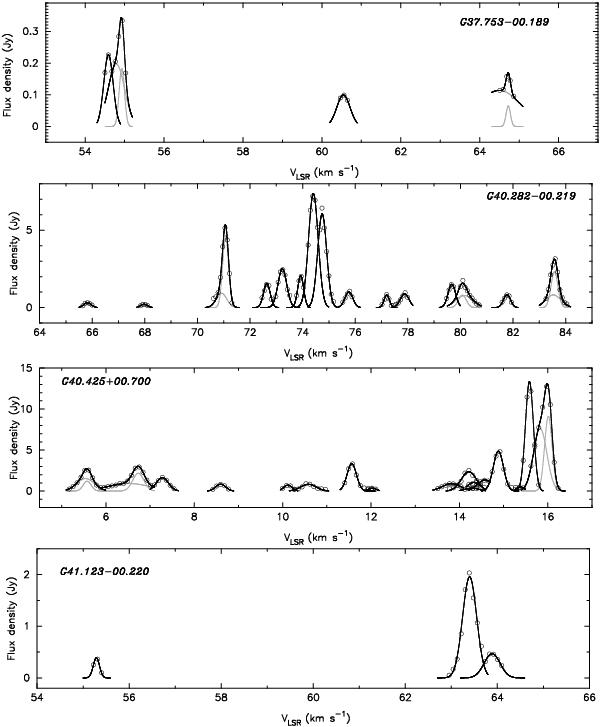
Spectra of individual 6.7 GHz maser clouds with Gaussian velocity profiles. Each circle traces the emission level of a single maser spot as presented in Figs. 1 and A.1. The black line represents the fitting of a Gaussian function (or functions) as summarized in Table B.1. The gray line presents the single Gaussian fitting in a case of complex velocity profile of an individual component.
Current usage metrics show cumulative count of Article Views (full-text article views including HTML views, PDF and ePub downloads, according to the available data) and Abstracts Views on Vision4Press platform.
Data correspond to usage on the plateform after 2015. The current usage metrics is available 48-96 hours after online publication and is updated daily on week days.
Initial download of the metrics may take a while.