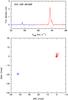
Fig. 1
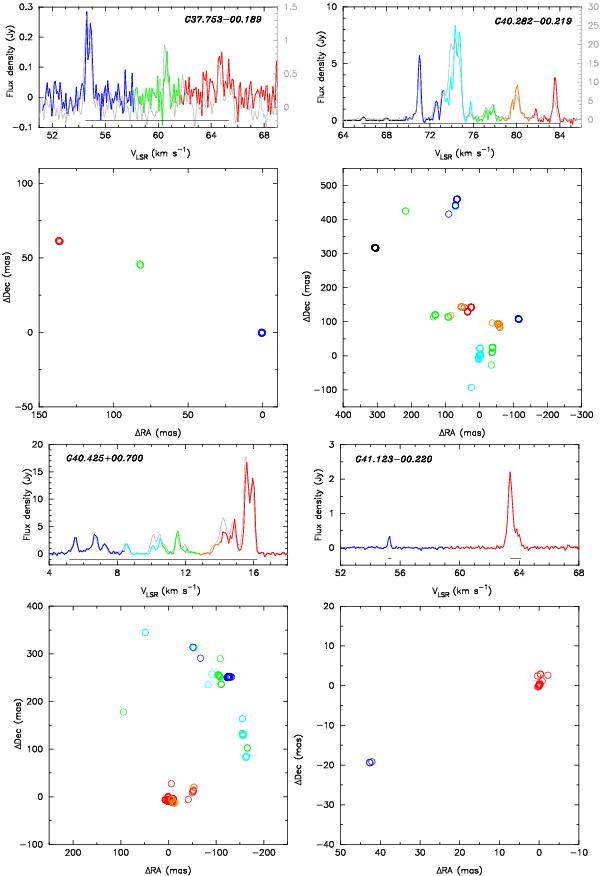
Spectra and maps of 6.7 GHz methanol masers detected using the EVN. The names are the Galactic coordinates of the brightest spots listed in Table 2. The colors of circles relate to the LSR velocities as shown in the spectra. The map origins are the locations of the brightest spots (Table 2). The gray lines show the Torun 32 m dish spectra. If needed, the separate scale of the flux density is presented on the left (EVN) and right (Torun) sides. The thin bars under the spectra show the LSR velocity ranges of spots displayed. The plots for the remaining targets are presented in Appendix A.
Current usage metrics show cumulative count of Article Views (full-text article views including HTML views, PDF and ePub downloads, according to the available data) and Abstracts Views on Vision4Press platform.
Data correspond to usage on the plateform after 2015. The current usage metrics is available 48-96 hours after online publication and is updated daily on week days.
Initial download of the metrics may take a while.