| Issue |
A&A
Volume 564, April 2014
|
|
|---|---|---|
| Article Number | L8 | |
| Number of page(s) | 4 | |
| Section | Letters | |
| DOI | https://doi.org/10.1051/0004-6361/201322448 | |
| Published online | 04 April 2014 | |
Formation of phase lags at the cyclotron energies in the pulse profiles of magnetized, accreting neutron stars
1 Leibniz-Institut für Astrophysik Potsdam (AIP), an der Sternwarte 16, 14482 Potsdam, Germany
e-mail: g.schoenherr@aip.de
2 Dr. Remeis-Sternwarte & ECAP, Sternwartstr. 7, 96049 Bamberg, Germany
3 INTEGRAL Science Data Centre, Université de Genève, chemin d’Écogia 16, 1290 Versoix, Switzerland
4 Institut für Astronomie und Astrophysik, Abt. Astronomie, Universität Tübingen, Sand 1, 72076 Tübingen, Germany
5 European Space Astronomy Centre (ESA/ESAC), Science Operations Dept., PO Box 78, 28691 Villanueva de la Cañada, Madrid, Spain
6 George Mason University, 4400 University Drive, Fairfax VA 22030, USA
7 High Energy Space Environment Branch, Space Science Division, Naval Research Laboratory, Washington DC 20375, USA
8 CRESST, University of Maryland Baltimore County and NASA’s Goddard Space Flight Center, Greenbelt MD 20771, USA
9 International Space Science Institute (ISSI), Hallerstr. 6, 3012 Bern, Switzerland
10 California Institute of Technology, Pasadena CA 91125, USA
Received: 6 August 2013
Accepted: 9 March 2014
Context. Accretion-powered X-ray pulsars show highly energy-dependent and complex pulse-profile morphologies. Significant deviations from the average pulse profile can appear, in particular close to the cyclotron line energies. These deviations can be described as energy-dependent phase lags, that is, as energy-dependent shifts of main features in the pulse profile.
Aims. Using a numerical study we explore the effect of cyclotron resonant scattering on observable, energy-resolved pulse profiles.
Methods. We generated the observable emission as a function of spin phase, using Monte Carlo simulations for cyclotron resonant scattering and a numerical ray-tracing routine accounting for general relativistic light-bending effects on the intrinsic emission from the accretion columns.
Results. We find strong changes in the pulse profile coincident with the cyclotron line energies. Features in the pulse profile vary strongly with respect to the average pulse profile with the observing geometry and shift and smear out in energy additionally when assuming a non-static plasma.
Conclusions. We demonstrate how phase lags at the cyclotron energies arise as a consequence of the effects of angular redistribution of X-rays by cyclotron resonance scattering in a strong magnetic field combined with relativistic effects. We also show that phase lags are strongly dependent on the accretion geometry. These intrinsic effects will in principle allow us to constrain a system’s accretion geometry.
Key words: X-rays: binaries / stars: neutron / methods: numerical
© ESO, 2014
1. Introduction
Accreting X-ray pulsars (see, e.g., Caballero & Wilms 2012, for a recent review) exhibit complex and highly energy-dependent pulse profiles (Lutovinov & Tsygankov 2009). These profiles can vary with time and luminosity, for instance over outbursts of transient sources (e.g., Tsygankov et al. 2006) or in the case of Her X-1 with a super-orbital period (Staubert et al. 2013). However, the detailed physical origin for this complexity is still poorly understood. A number of efforts in the past have attempted to disentangle the components of intrinsic beam patterns for individudal sources by a complex “backward” approach as described by Kraus et al. (1995), by Fourier-decomposing the observed pulse profiles into individual contributions of radiation from the poles (e.g., Kraus et al. 1996; Caballero et al. 2011; Sasaki et al. 2012). While this approach has proven to be very successful in offering possible solutions for the beam patterns, that is, the angle- and energy-dependent emissivity of X-rays at each pole, it does not address the physical processes that yield these beam patterns, nor does it result in a unique choice among several possible solutions.
The most striking feature of many observations is that X-ray pulse profiles are strongly energy dependent. This is especially apparent in the energy-dependent location of the main pulse peak, which changes significantly in pulse phase, that is, the main peak shows a phase lag (Tsygankov et al. 2007, 2006; Ferrigno et al. 2011). This phase lag, relative to the mean pulse profile, is most apparent around the energy of the cyclotron line, at energies where photons can scatter resonantly with electrons on Landau orbits in the strong magnetic field of the accretion column and where the scattering cross section is strongly angle dependent.
In this Letter, we present a new approach in which pulse profiles are calculated based on a self-consistent physical model of the intrinsic radiation pattern at the two magnetic poles, including all general relativistic effects such as light bending or gravitational redshifting (Sect. 2). This approach follows early fundamental works on the radiation from cyclotron line sources (see, e.g., Mészáros & Riffert 1988; Sturner & Dermer 1994; Zheleznyakov & Litvinchuk 1986; Soffel et al. 1985, and references therein), but differs in numerical method. This allows for the resolution of model spectra and pulse profiles at a new level, as we illustrate here for one characteristic observable, energy-dependent pulse profiles (Sect. 3). We explore under which conditions intrinsic deviations from the mean, energy averaged pulse profile due to cyclotron resonance scattering lead to the formation of characteristic phase lags relative to the mean pulse profile at the cyclotron energies.
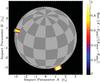 |
Fig. 1 Observer’s view of a neutron star, illustrating the general relativistic effects on the visibility and flux of two accretion columns for an observer at infinite distance from the neutron star. Sky coordinates are parameterized through the impact parameters A and B, which correspond to the projected distance from the gravitational center in units of the Schwarzschild radius, rs. The illustration corresponds to the two-pole geometry used in Sect. 3.2. Different apparent sizes of the accretion columns are due to strong light-bending effects. |
2. Model setup
We considered a canonical neutron star (M = 1.4 M⊙, R = 10 km) with a strong magnetic field on the order of several 1012 G that accretes matter onto two magnetic poles (see Fig. 1). We furthermore assumed that we observe only lateral emission from the walls of possibly elongated accretion columns, a “fan beam scenario”. For sources with clearly defined cyclotron lines, this necessarily induces the postulation of a constrained “efficient area of the accretion column to line formation” (Nishimura 2008), which must be of practicable negligible magnetic field gradient. The X-ray emitting region of the accretion column at each pole is therefore modeled by a simple, homogeneous, small cylindrical volume. The location, radius, and height of the cylindrical volume, the location of the accretion columns with respect to the spin axis of the neutron star, and the inclination of the system with respect to the observer are free model parameters. We do not address any possible “pencil beam” radiation components, nor do we consider surface reflection (see, e.g., Poutanen et al. 2013) for this pilot study.
The plasma electrons have a Maxwellian temperature distribution parallel to the B-field and are magnetically quantized in their perpendicular momenta. We generated the intrinsic beam pattern at each pole by reprocessing X-ray continuum seed photons from the column by cyclotron resonant scattering between electrons and X-ray photons in its outer layer. This picture is motivated by the comparably very small mean free path of resonant photons that translates into a thin “scattering atmosphere” around the optically thick core. The scattering of photons and electrons causes cyclotron resonant scattering features (if observable) in the source spectrum at En,cyc ~ n 11.6 B [1012 G] /(1 + z) keV, where z is the gravitational redshift and n is an integer. In the following we assume B = 4 × 10¹² G, a parallel electron temperature of kTe = 3 keV, and a cyclotron scattering atmosphere with Thomson optical depth τ = 10-3 perpendicular to the B-field axis (see, e.g., Schönherr et al. 2007; Suchy et al. 2008).
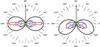 |
Fig. 2 Energy-resolved beam patterns after cyclotron scattering for a cylindrical geometry (“fan beam”). Left: case of a static plasma. Right: plasma with bulk velocity v = 0.4c. The black line shows the angular distribution of all photons. The red, green, and blue lines mark photons escaping at energies close to the cyclotron resonances for the respective angles (not to scale). While the photons that escape at the fundamental resonance (red) have all undergone scattering, the photons escaping at the higher resonances are unaltered from the continuum (see Schwarm et al. 2013). |
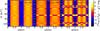 |
Fig. 3 Energy-dependent flux as a function of pulse phase for different observation angles iobs = 25°, 50°, and 75°from left to right (see Sect. 3.1 for the geometrical set-up). The pulse profiles are normalized such that for every energy bin the mean flux is zero and the corresponding standard deviation is unity (after Ferrigno et al. 2011). The pulse profiles are plotted twice for clarity. |
Because we wish to investigate the isolated effects of beaming by cyclotron resonant scattering on the observable pulse profiles separated from possible continuum effects, we assumed the continuum radiation to be isotropic and to have a simple power-law spectrum with a photon index Γ = 1. The assumption of isotropy is justified as the intrinsic beaming of the continuum radiation is expected to be comparably weak. For a fast falling plasma, an overall downward beaming has to be taken into account as well (see Lyubarsky & Sunyaev 1988). The energy and angular redistribution of the continuum while passing the cyclotron scattering layer were calculated based on Monte Carlo simulations of Schwarm (2010, 2013), which follow the same fundamental physical setup as described in detail by Araya & Harding (1999), Schönherr et al. (2007), and references therein. Fully relativistic cross-sections (Sina 1996) were used to describe the polarization-averaged scattering process. Again, to bring out the effects of cyclotron scattering on the pulse profiles, identical optical depths and B-field strengths were assumed for both poles. We obtain the flux emitted from each point of the surface of the walls of the cylindrical volume as a function of energy and angle with respect to the B-field.
We considered both static volumes and a falling plasma with a bulk velocity of 0.4c (see Fig. 2). The effect of a bulk velocity on our simulation results is discussed in more detail by Schwarm et al. (2013). For earlier work on cyclotron resonant scattering in non-static plasmas see, e.g., Soffel et al. (1985), Isenberg et al. (1998), and Serber (2000). As the large-scale B-field structure of high-mass X-ray binaries and the magnetospheric coupling of the accretion flow are poorly constrained, we considered both a symmetric geometry and a geometry where the magnetic poles are displaced in longitude and latitude with respect to an antipodal setting. The latter has been shown to be one option to generate asymmetric pulse profiles that resemble observed ones from otherwise symmetric assumptions (e.g., Bulik et al. 1995; Kraus et al. 1996; Caballero et al. 2011; Sasaki et al. 2012). We calculated the observed time and energy-dependent flux from these setups with a fully relativistic ray-tracing code that includes light bending, gravitational redshifting, and special relativistic effects due to the motion of the emitter (Falkner et al. 2013).
3. Energy-dependent pulse profiles
3.1. Symmetric geometry
First, we discuss a symmetric, antipodal geometry of two static accretion columns of radius r1 = r2 = 1 km and height h1 = h2 = 100 m, which are displaced at an angle i1 = i2 = 35° with respect to the spin axis of the neutron star. Because we assumed a constant magnetic B-field, the heights hi do not represent a realistic accretion column structure. They instead rather reflect the uncertainty of the height from which emission from a sufficiently constrained line-forming region is observed, which for this example was assumed to be somewhere at the base of the column not farther than 100 m from the surface. Figure 3 shows the resulting energy-dependent pulse profiles for different observing angles. Horizontal cuts through the figures represent pulse profiles at a given energy, while vertical cuts represent the deviation of the X-ray spectrum from a normalizing continuum at a given pulse phase. Observing this system at a line of sight tilted by iobs = 25° with respect to the rotational axis results in practically no features being apparent from which one might distinguish between the relative pulse profiles at different energies. Observations would show one symmetric broad pulse over the entire energy range. With increasing iobs, the main peak of the pulse profile becomes narrower and strong deviations of the pulse profiles appear around the redshifted cyclotron line energies (~32, 64, and 96 keV). These changes can be understood from the very strong perpendicular beaming of photons that escape at the cyclotron energies (Fig. 2). These photons can come into view of the observer, for a suitable geometric setup, at a pulse phase when most of the main beam at all other energies is still hidden.
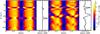 |
Fig. 4 Color plots: flux maps for the geometry of Fig. 1. The additional white panels show the corresponding energy-dependent phase shifts as calculated with respect to the full energy pulse profile using cross-correlation as described in detail and applied to observational data by Ferrigno et al. (2011). Left: static plasma. Right: downward bulk velocity of v = 0.4c. The values of B, kTe, and τ as well as the flux scaling are the same as in Fig. 3 (see Sect. 3.1). |
3.2. “Wavy” phase lags
Motivated by an observational study of phase lags, we demonstrate the effects of strong asymmetry of the location of the accretion columns and of a non-static plasma for one specific example: to explain the strong changes in the highly asymmetric and variable pulse profiles of the accreting X-ray pulsar 4U0115+63, Ferrigno et al. (2011) invoked a two-pole geometry with i1 = 74°, i2 = 32° and a phase offset of 68° for an observation angle of iobs = 60°, as was proposed by Sasaki et al. (2012) from applying the pulse decomposition method to this source. The authors additionally assumed laterally emitting columns of r1 = r2 ~ 700 m and h1 = h2 = 2 km (Fig. 1) and heuristically modeled the intrinsic emissivity pattern from these columns as the sum of an upward and a downward pointing beam with a Gaussian emissivity profile. From purely geometric considerations they proposed that a relatively enhanced upward component at the cyclotron line energies might be causing the observed pulse profile changes and the associated strong phase shifts.
We now adopt the same parameters for the two-pole accretion column geometry of our numerical model. The relative fluxes generated from a constrained emitting volume of given parameters – in particular a given value for the magnetic field B for a source with sharp cyclotron lines – located at arbitrary height between the top of the accretion mound and 2 km up in the column above the surface show very little variation. Therefore, we used spatially averaged fluxes (Fig. 4) for our further analysis. In contrast to Ferrigno et al. (2011) we did not assume any artificially imposed beamed emission patterns. Instead, as discussed for the symmetric setting in the previous paragraph, we used the simulated intrinsic beam patterns of the photons that were redistributed in angle by cyclotron resonant scattering (see Fig. 2 and Schönherr et al. 2007; Schwarm et al. 2013). Figure 4 shows the energy-dependent pulse profiles and associated phase lags for a static plasma and for a non-static plasma with a bulk velocity of v = 0.4c within the line-forming region. While for the static plasma the phase shifts of the peak at the cyclotron energies relative to the mean pulse profile are very localized and rather small, the introduction of a bulk velocity component yields a broad and wavy morphology similar to the observed one (see Figs. 3 and 5 of Ferrigno et al. 2011).
A fast-falling plasma can significantly enhance the angular difference in beaming between the contribution from photons at the cyclotron fundamental resonance and the overall radiation: for a static plasma the photons at the cyclotron fundamental mostly escape perpendicular to the field (Fig. 2, left) and only the neutron star surface introduces an asymmetry with respect to the overall radiation. For the case of bulk velocity a broader downward beam at the cyclotron fundamental and upward beams at the cyclotron higher harmonics are generated (Fig. 2, right). Hence, the phase dependence of peaks at the fundamental and the harmonic cyclotron features are expected to differ for an appropriate geometry, as has been seen in 4U0115+63 (Tsygankov et al. 2007). This might also explain the observed different energy localisation of the maximum negative phase displacement of the pulse profile peak with respect to the fundamental and first harmonic scattering feature in the study by Ferrigno et al. (Figs. 7 and 8 of Ferrigno et al. 2011).
4. Discussion and conclusions
The fact that we still lack basic knowledge about the coupling of the accretion flow to the magnetosphere, which determines the location and geometry of the emitting regions, unfortunately adds a significant amount of freedom to theoretical predictions of pulse profiles of X-ray pulsars. It is therefore important to identify and understand characteristic trends in the simulations that are comparable to observable ones to narrow down the physically reasonable parameter space and to prepare the grounds for future proper fits of a model to observations. Focusing on the investigation of the formation of strong changes in the pulse profile at the cyclotron energies, we have shown how phase shifts relative to the energy-averaged pulse profile arise naturally from the intrinsic beaming by cyclotron resonant scattering processes for suitable geometrical setups. The assumption of a static versus a non-static plasma has proven to be highly relevant for the overall pulse profile morphology. A next step will be to investigate more complex geometries, for example height-dependent velocity gradients, temperature profiles and B-field geometries. Especially for the non-static case the relevance of a possible reflection component from the surface due to strong downward beaming of radiation needs to be investigated. The understanding of scattering related, apparent phase lags allows us to separate their physical origin from other geometric effects that can cause changes in the morphology of the energy-dependent pulse profiles such as a height-dependent continuum or occultations by the accretion flow.
Acknowledgments
We thank the International Space Science Institute ISSI in Bern (CH) for granting two International Team meetings on “The physics of the accretion column of X-ray pulsars”, which have much inspired this collaborative work. We also thank the Bundesministerium für Wirtschaft und Technologie for funding through Deutsches Zentrum für Luft- und Raumfahrt grant 50 OR 1113. M.T.W. is supported by the US Office of Naval Research and the NASA ADAP Program under grant NNH13AV18I. We thank the anonymous referee for very useful comments.
References
- Araya, R. A., & Harding, A. K. 1999, ApJ, 517, 334 [NASA ADS] [CrossRef] [Google Scholar]
- Bulik, T., Riffert, H., Mészáros, P., et al. 1995, ApJ, 444, 405 [NASA ADS] [CrossRef] [Google Scholar]
- Caballero, I., & Wilms, J. 2012, Mem. Soc. Astron. It. 83, 230 [Google Scholar]
- Caballero, I., Kraus, U., Santangelo, A., et al. 2011, A&A, 526, A131 [NASA ADS] [CrossRef] [EDP Sciences] [Google Scholar]
- Falkner, S., Dauser, T., Falanga, M., & Wilms, J. 2013, Acta Polytechnica, in press [Google Scholar]
- Ferrigno, C., Falanga, M., Bozzo, E., et al. 2011, A&A, 532, A76 [NASA ADS] [CrossRef] [EDP Sciences] [Google Scholar]
- Isenberg, M., Lamb, D. Q., & Wang, J. C. L. 1998, ApJ, 493, 154 [NASA ADS] [CrossRef] [Google Scholar]
- Kraus, U., Nollert, H. P., Ruder, H., & Riffert, H. 1995, ApJ, 450, 763 [NASA ADS] [CrossRef] [Google Scholar]
- Kraus, U., Blum, S., Schulte, J., et al. 1996, ApJ, 467, 794 [NASA ADS] [CrossRef] [Google Scholar]
- Lutovinov, A., & Tsygankov, S. 2009, ApJ, 35, 433 [Google Scholar]
- Lyubarsky, Y. E., & Sunyaev, R. A. 1988, Sov. Astron. Lett., 14, 390 [NASA ADS] [Google Scholar]
- Mészáros, P., & Riffert, W., 1988, ApJ, 327, 712 [NASA ADS] [CrossRef] [Google Scholar]
- Nishimura, O. 2008, ApJ, 672, 1127 [NASA ADS] [CrossRef] [Google Scholar]
- Poutanen, J., Mushtukov, A., Suleimanov, V., et al. 2013, Astron. Lett., 777, 115 [Google Scholar]
- Sasaki, M., Müller, D., Kraus, U., et al. 2012, A&A, 540, A35 [NASA ADS] [CrossRef] [EDP Sciences] [Google Scholar]
- Schönherr, G., Wilms, J., Kretschmar, P., et al. 2007, A&A, 472, 353 [NASA ADS] [CrossRef] [EDP Sciences] [Google Scholar]
- Schwarm, F. W. 2010, Diplomarbeit, University of Erlangen-Nuremberg, Germany [Google Scholar]
- Schwarm, F. W., Schönherr, G., Kühnel, M., Wilms, J. 2013, in Physics at the Magnetospheric Boundary, eds. E. Bozzo, et al., European Physical Journal Web of Conferences, 64 [Google Scholar]
- Serber, A. 2000, Astron. Rep., 44, 815 [NASA ADS] [CrossRef] [Google Scholar]
- Sina, R. 1996, Ph.D. Thesis, University of Maryland, USA [Google Scholar]
- Soffel, M., Herold, H., Ruder, H., & Ventura, J. 1985, A&A, 144, 485 [NASA ADS] [Google Scholar]
- Staubert, R., Klochkov, D., Postnov, K., et al. 2013, A&A, 550, A110 [NASA ADS] [CrossRef] [EDP Sciences] [Google Scholar]
- Sturner, S. J., & Dermer, C. D. 1994, A&A, 284, 161 [NASA ADS] [Google Scholar]
- Suchy, S., Pottschmidt, K., Wilms, J., et al. 2008, ApJ, 675, 1487 [NASA ADS] [CrossRef] [Google Scholar]
- Tsygankov, S. S., Lutovinov, A. A., Churazov, E. M., & Sunyaev, R. A. 2006, MNRAS, 371, 19 [NASA ADS] [CrossRef] [Google Scholar]
- Tsygankov, S., Lutovinov, A., Churazov, E., & Sunyaev, R. 2007, in The 6th Integral Workshop: The Obscured Universe, eds. R. Sunyaev, S. Grebenev, C. Winkler, ESA SP, 622, 430 [Google Scholar]
- Zheleznyakov, V. V., & Litvinchuk, A. A. 1986, in Plasma Astrophysics, eds. T. D. Guyenne, L. M. Zeleny, ESA SP, 251, 375 [Google Scholar]
All Figures
|
Fig. 1 Observer’s view of a neutron star, illustrating the general relativistic effects on the visibility and flux of two accretion columns for an observer at infinite distance from the neutron star. Sky coordinates are parameterized through the impact parameters A and B, which correspond to the projected distance from the gravitational center in units of the Schwarzschild radius, rs. The illustration corresponds to the two-pole geometry used in Sect. 3.2. Different apparent sizes of the accretion columns are due to strong light-bending effects. |
| In the text | |
|
Fig. 2 Energy-resolved beam patterns after cyclotron scattering for a cylindrical geometry (“fan beam”). Left: case of a static plasma. Right: plasma with bulk velocity v = 0.4c. The black line shows the angular distribution of all photons. The red, green, and blue lines mark photons escaping at energies close to the cyclotron resonances for the respective angles (not to scale). While the photons that escape at the fundamental resonance (red) have all undergone scattering, the photons escaping at the higher resonances are unaltered from the continuum (see Schwarm et al. 2013). |
| In the text | |
|
Fig. 3 Energy-dependent flux as a function of pulse phase for different observation angles iobs = 25°, 50°, and 75°from left to right (see Sect. 3.1 for the geometrical set-up). The pulse profiles are normalized such that for every energy bin the mean flux is zero and the corresponding standard deviation is unity (after Ferrigno et al. 2011). The pulse profiles are plotted twice for clarity. |
| In the text | |
|
Fig. 4 Color plots: flux maps for the geometry of Fig. 1. The additional white panels show the corresponding energy-dependent phase shifts as calculated with respect to the full energy pulse profile using cross-correlation as described in detail and applied to observational data by Ferrigno et al. (2011). Left: static plasma. Right: downward bulk velocity of v = 0.4c. The values of B, kTe, and τ as well as the flux scaling are the same as in Fig. 3 (see Sect. 3.1). |
| In the text | |
Current usage metrics show cumulative count of Article Views (full-text article views including HTML views, PDF and ePub downloads, according to the available data) and Abstracts Views on Vision4Press platform.
Data correspond to usage on the plateform after 2015. The current usage metrics is available 48-96 hours after online publication and is updated daily on week days.
Initial download of the metrics may take a while.