Fig. 4
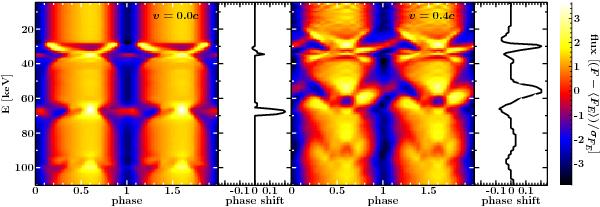
Color plots: flux maps for the geometry of Fig. 1. The additional white panels show the corresponding energy-dependent phase shifts as calculated with respect to the full energy pulse profile using cross-correlation as described in detail and applied to observational data by Ferrigno et al. (2011). Left: static plasma. Right: downward bulk velocity of v = 0.4c. The values of B, kTe, and τ as well as the flux scaling are the same as in Fig. 3 (see Sect. 3.1).
Current usage metrics show cumulative count of Article Views (full-text article views including HTML views, PDF and ePub downloads, according to the available data) and Abstracts Views on Vision4Press platform.
Data correspond to usage on the plateform after 2015. The current usage metrics is available 48-96 hours after online publication and is updated daily on week days.
Initial download of the metrics may take a while.