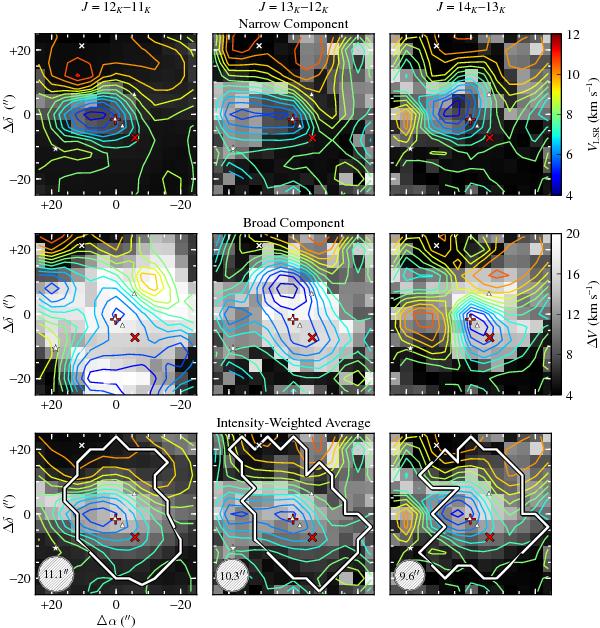
Fig. 9

Distribution of the LSR velocity (VLSR, coloured contours) and line width (ΔV, greyscale maps) of methyl cyanide J = 12K−11K (left), J = 13K−12K (centre), and J = 14K−13K (right) emission across the Orion KL region, as determined from simultaneous Gaussian fits to the K = 0−10 lines (see Sect. 4.1 for details). The three rows show the kinematic properties from the two-component fits for the narrow component (top), the broad component (middle), and the intensity-weighted average of the two (bottom). Thick white contours on the bottom panels indicate the regions where two kinematic components were required to obtain a good fit to the line profiles. The various sources indicated are as described in Fig. 1.
Current usage metrics show cumulative count of Article Views (full-text article views including HTML views, PDF and ePub downloads, according to the available data) and Abstracts Views on Vision4Press platform.
Data correspond to usage on the plateform after 2015. The current usage metrics is available 48-96 hours after online publication and is updated daily on week days.
Initial download of the metrics may take a while.


