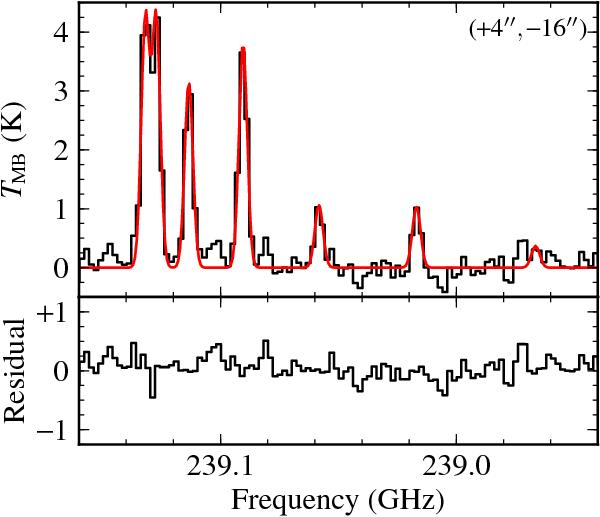
Fig. 8

Best-fit Gaussian profiles for the J = 13−12, K = 0−6 methyl cyanide lines at the offset position (+4″, −16″) in the Orion KL map. Identical line widths and central velocities were assumed for all K-ladder transitions within a given kinematic component (see Sect. 4.1). The K-ladder lines above K = 6 were not detected at this position, so are excluded from the figure. Only one kinematic component (shown in red) is necessary to obtain a good fit in this case.
Current usage metrics show cumulative count of Article Views (full-text article views including HTML views, PDF and ePub downloads, according to the available data) and Abstracts Views on Vision4Press platform.
Data correspond to usage on the plateform after 2015. The current usage metrics is available 48-96 hours after online publication and is updated daily on week days.
Initial download of the metrics may take a while.


