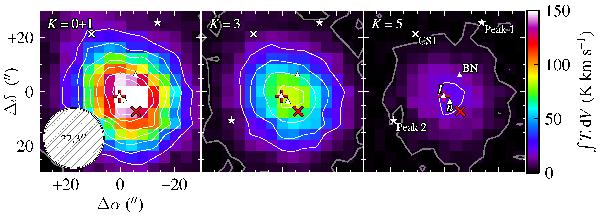
Fig. 1

Integrated intensity maps of methyl cyanide J = 6K−5K emission across the Orion KL
region. Contours are plotted at the 3-sigma level
( K km s-1; grey lines) and from 20
to 140 in 20 K km s-1 intervals (white lines). The positions of the hot
core and compact ridge are indicated by a red plus sign and a diagonal cross,
respectively. The locations of radio continuum sources BN, I, and
n are also marked on each panel by white triangles. Peaks 1 and 2
of the H2
emission are indicated by white stars and the condensation CS1 is marked by a white
cross. Extended emission to the northeast of the hot core is clearly visible in the
lower K
transitions.
Current usage metrics show cumulative count of Article Views (full-text article views including HTML views, PDF and ePub downloads, according to the available data) and Abstracts Views on Vision4Press platform.
Data correspond to usage on the plateform after 2015. The current usage metrics is available 48-96 hours after online publication and is updated daily on week days.
Initial download of the metrics may take a while.


