Fig. 4
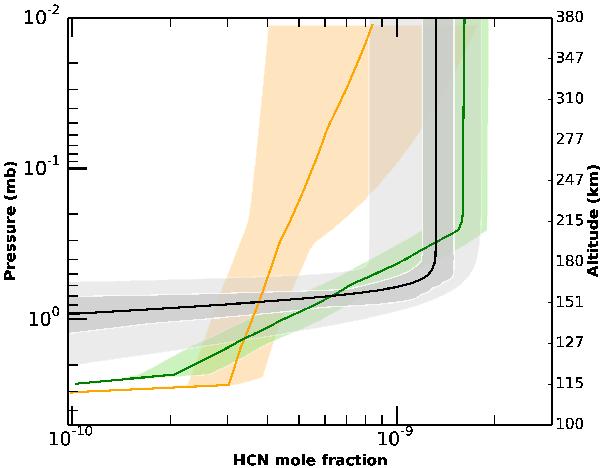
HCN mole fraction profile obtained with the best fit to the data (thick black line). Other possible profiles fitting the data based on the χ2 within 1σ noise are shown as the shaded (dark gray) envelope, and the total 1σ uncertainty plotted in light gray. For comparison, we show the profiles of Lellouch et al. (1994) (thick orange) and Marten et al. (2005) (thick green) along with their estimated uncertainties (shaded regions of the respective colors).
Current usage metrics show cumulative count of Article Views (full-text article views including HTML views, PDF and ePub downloads, according to the available data) and Abstracts Views on Vision4Press platform.
Data correspond to usage on the plateform after 2015. The current usage metrics is available 48-96 hours after online publication and is updated daily on week days.
Initial download of the metrics may take a while.