Fig. 2
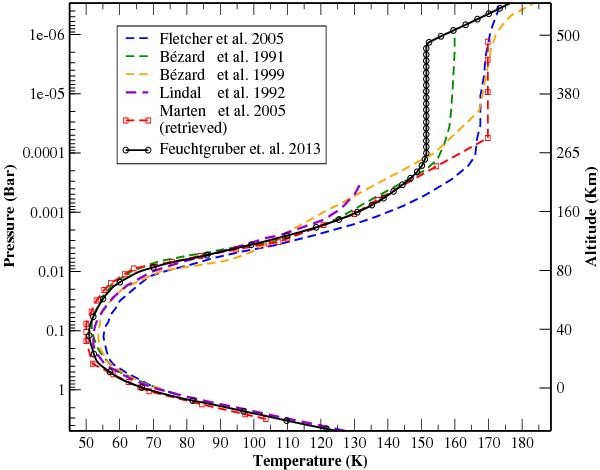
Disk-averaged kinetic temperature profiles obtained from several different observations during the past 20 years. The largest differences are on the order of 5 K around tropopause, but increase to more than 15 K at 1 mbar. The temperature profile retrieved by Marten et al. (2005) is shown in red. In our analysis, we use the profile from Feuchtgruber et al. (2013) plotted with a thick black line with squares.
Current usage metrics show cumulative count of Article Views (full-text article views including HTML views, PDF and ePub downloads, according to the available data) and Abstracts Views on Vision4Press platform.
Data correspond to usage on the plateform after 2015. The current usage metrics is available 48-96 hours after online publication and is updated daily on week days.
Initial download of the metrics may take a while.