| Issue |
A&A
Volume 563, March 2014
|
|
|---|---|---|
| Article Number | A137 | |
| Number of page(s) | 6 | |
| Section | Atomic, molecular, and nuclear data | |
| DOI | https://doi.org/10.1051/0004-6361/201323190 | |
| Published online | 25 March 2014 | |
Rotational spectroscopy of methylamine up to 2.6 THz⋆
1
Laboratoire de Physique des Lasers, Atomes, et Molécules, UMR CNRS 8523,
Université de Lille 1,
59655
Villeneuve d’Ascq Cedex,
France
e-mail:
This email address is being protected from spambots. You need JavaScript enabled to view it.
2
Institute of Radio Astronomy of NASU, Chervonopraporna, 4, 61002
Kharkov,
Ukraine
3
Jet Propulsion Laboratory, California Institute of Technology,
4800 Oak Grove
Drive, Pasadena
CA
91109-8099,
USA
Received:
4
December
2013
Accepted:
20
January
2014
Abstract
Context. Methylamine (CH3NH2) is the simplest primary alkylamine that has been detected in the interstellar medium. The molecule is relatively light, with the 50 K Boltzmann peak appearing near 800 GHz. However, reliable predictions for its rotational spectrum are available only up to 500 GHz. Spectroscopic analyses have been complicated by the two large-amplitude motions: internal rotation of the methyl top and inversion of the amino group.
Aims. To provide reliable predictions of the methylamine ground state rotational spectrum above 500 GHz, we studied its rotational spectrum in the frequency range from 500 to 2650 GHz.
Methods. The spectra of methylamine were recorded using the spectrometers based on Schottky diode frequency multiplication chains in the Lille laboratory (500−945 GHz) and in JPL (1060−2660 GHz). The analysis of the rotational spectrum of methylamine in the ground vibrational state was performed on the basis of the group-theoretical high barrier tunneling Hamiltonian developed for methylamine by Ohashi and Hougen.
Results. In the recorded spectra, we have assigned 1849 new rotational transitions of methylamine. They were fitted together with previously published data, to a Hamiltonian model that uses 76 parameters with an overall weighted rms deviation of 0.87. On the basis of the new spectroscopic results, predictions of transition frequencies in the frequency range up to 3 THz with J ≤ 50 and Ka ≤ 20 are presented.
Key words: ISM: molecules / methods: laboratory: molecular / submillimeter: ISM / molecular data / line: identification
Full Tables 2 and 3 are only available at the CDS via anonymous ftp to cdsarc.u-strasbg.fr130.79.128.5 or via http://cdsarc.u-strasbg.fr/viz-bin/qcat?J/A+A/563/A137
© ESO, 2014
1. Introduction
Methylamine (CH3NH2) is a seven-atom organic molecule and the simplest primary alkylamine. Methylamine is considered as a precursor of the simplest amino acid glycine. Recent experimental studies have shown several reaction pathways to forming glycine in water containing ices starting from CH3NH2 and CO2 subjected to high energy electrons (Holtom et al. 2005) or UV radiation (Bossa et al. 2009; Lee et al. 2009). Under similar conditions glycine can decompose to yield methylamine and CO2 (Ehrenfreund et al. 2001). Interstellar methylamine was first detected toward Sgr B2 at 3.5 cm (Fourikis et al. 1974) and at 3 mm (Kaifu et al. 1974). Recently, methylamine has been detected in a spiral galaxy with a high redshift of 0.89 located in front of the quasar PKS 1830-211 (Muller et al. 2011). It was also observed in cometary samples of the Stardust mission (Glavin et al. 2008).
Despite its astrophysical importance, the current knowledge of the rotational spectrum of methylamine is limited in terms of frequency coverage and in assignments of the J quanta. The limitation was caused by the complexity of theoretical treatment that involved the two large amplitude motions present in the molecule: the torsional (internal rotation) motion of the methyl moiety and the wagging (inversion) motion of the amino group. Both motions are hindered by barriers of intermediate height (23.2 kJ/mol (2796 K) for the wagging, and 8.6 kJ/mol (1033 K) for the torsion, see Kreglewski 1989), but thanks to the leading role of light hydrogen atoms in the tunneling process, the tunneling splittings observed in the rotational spectra are large (up to several tens of GHz). Earlier studies of methylamine were performed mostly in cm-wave range (Lide 1954; Shimoda et al. 1954; Hirakawa et al. 1956; Nishikawa 1957) and in the lower part of the mm-wave range below 100 GHz (Takagi & Kojima 1971, 1973) as a support for astrophysical observations. All these measurements were summarized by Ohashi et al. (1987) and complemented with new far-infrared rotational transitions and ground-state combination differences determined from the fundamental torsional band.
Later publications represent the extension of the methylamine data set further into millimeter- and submillimeter-wave ranges (Kreglewski & Wlodarczak 1992; Ilyushin et al. 2005), as well as high resolution measurements for accurately determining of hyperfine constants (Kreglewski et al. 1992). The most recent critical review of all previously available data on the rotational spectrum of methylamine in the ground vibrational state by Ilyushin & Lovas (2007) covers the frequency range up to 500 GHz and includes the calculated transition frequencies for J < 30. At the same time, methylamine is a rather light molecule with the maximum in intensity distribution of the rotational transitions lying near 2 THz for T = 300 K. In the interstellar medium, the temperatures are typically lower so the absorption maximum is shifted to lower frequencies. For example, toward Sgr B2(N) the rotational temperature of methylamine was recently determined to be 159(39) K by Halfen et al. (2013), and a temperature of 100 K was suggested by Belloche et al. (2013) for the same source. In addition, in the survey by Belloche et al. (2013) methylamine was observed towards Sgr B2(M) with a rotational temperature around 50 K. According to our estimations for T = 150 K, the absorption maximum of rotational spectrum of methylamine is at 1.5 THz, and it is shifted down to 0.8 THz for T = 50 K. Therefore there is a clear interest in the reliable predictions of the methylamine rotational spectrum above 500 GHz especially regarding the sub-THz coverage of the ALMA project. Simple extrapolation of frequency predictions for molecules exhibiting large amplitude motions may be unreliable in view of the high level of nonrigidity. In this context we present here a new study of the methylamine spectrum with measurements and analysis extended up to 2.6 THz.
2. Experiments
In the frequency range 500−945 GHz we recorded the rotational spectrum of methylamine using the Lille spectrometer based on solid-state sources. We used a commercial sample of methylamine with 99% purity. The optimum gas pressure in the absorption cell providing the best signal-to-noise ratio of the recorded spectra was between 60−70 μbar, with higher pressures preferred in the higher frequency range. Under this condition the observed molecular absorption line shapes were described well with a Voigt profile in which the Doppler and pressure broadening contributions are related as 2 to 1. Owing to additional line broadening caused by unresolved (or partially resolved) quadrupole hyperfine structure, the estimated measurement uncertainty for the strong isolated lines was conservatively taken to be 60 kHz which is somewhat higher compared to the value of 30 kHz usually provided by the Lille spectrometer. The frequencies of the lines with poor signal-to-noise ratio and distorted line shape were estimated to have uncertainties of 100−200 kHz.
Measurements from Jet Propulsion Laboratory (JPL) utilized a modular frequency multiplication spectrometer built from a microwave synthesizer and amplifier-multiplier components (Drouin et al. 2005; Pearson et al. 2011). Measurements were done at room temperature in the following frequency windows: 1.061−1.093 THz, 1.575−1.625 THz and 2.560−2.660 THz at pressures ranging from 25−140 μbar. Estimated uncertainties are 100 kHz, 200 kHz and 500 kHz depending on the width of the observed lines and distortions in the lineshapes.
3. Assignment and analysis of the spectrum
3.1. Theoretical model
The phenomenological Hamiltonian used in the present study is based on the
group-theoretical high-barrier tunneling formalism developed for methylamine by Ohashi & Hougen (1987). The formalism appeared
to be the most successful in fitting the rotational spectrum of methylamine in the ground
state as well as in the first excited torsional state. The Hamiltonian operator is defined
as ![Mathematical equation: \begin{eqnarray} H &=& h_v + h_jJ^2+h_kJ_z^2+(f_+J_+^2+f_-J_-^2)+qJ_z \nonumber\\ &&\quad + \, (r_+J_++r_-J_-)+[s_+(J_+J_z+J_zJ_+) \\ &&\quad+ \, s_-(J_-J_z+J_zJ_-)]+(f_+^{(2)}J_+^4+f_-^{(2)}J_-^4) \nonumber\\ &&\quad + \, \mathrm{higher\:order\:terms}\nonumber \end{eqnarray}](/articles/aa/full_html/2014/03/aa23190-13/aa23190-13-eq13.png) (1)where
“higher order terms” represent ordinary centrifugal distortion terms as well as the
J and
K
dependences of the various tunneling splitting parameters. Hamiltonian matrix elements of
the various operators are expanded in Fourier series whose nth term represents a
tunneling process from molecular framework 1 to molecular framework n (see the paper Ohashi & Hougen 1987, for definition of the
frameworks in methylamine). In the notation adopted, the subscript n = 1 corresponds to
nontunneling motion. The even subscripts n = 2, 4, 6...
designate tunneling involving inversion of the amine group. The odd subscripts
n = 3, 5, 7...
refer to tunneling involving only torsional motion of the methyl group. Thus, the
tunneling from framework 1 to framework 2 corresponds to the inversion of amino group
followed by 60°
internal rotation of the methyl group, whereas the tunneling from framework 1 to framework
3 corresponds to the internal rotation of the methyl group by 120°. Corresponding to this approach
the coefficients hnv, hnJ, qn etc. (n ≠ 1), which appear in the
table of molecular constants refer to different tunneling processes in the molecule, while
the coefficients with n = 1 are represented by usual asymmetric rotor
Hamiltonian.
(1)where
“higher order terms” represent ordinary centrifugal distortion terms as well as the
J and
K
dependences of the various tunneling splitting parameters. Hamiltonian matrix elements of
the various operators are expanded in Fourier series whose nth term represents a
tunneling process from molecular framework 1 to molecular framework n (see the paper Ohashi & Hougen 1987, for definition of the
frameworks in methylamine). In the notation adopted, the subscript n = 1 corresponds to
nontunneling motion. The even subscripts n = 2, 4, 6...
designate tunneling involving inversion of the amine group. The odd subscripts
n = 3, 5, 7...
refer to tunneling involving only torsional motion of the methyl group. Thus, the
tunneling from framework 1 to framework 2 corresponds to the inversion of amino group
followed by 60°
internal rotation of the methyl group, whereas the tunneling from framework 1 to framework
3 corresponds to the internal rotation of the methyl group by 120°. Corresponding to this approach
the coefficients hnv, hnJ, qn etc. (n ≠ 1), which appear in the
table of molecular constants refer to different tunneling processes in the molecule, while
the coefficients with n = 1 are represented by usual asymmetric rotor
Hamiltonian.
In the Hamiltonian (1) the nontunneling value of hv corresponds to an
absolute energy offset for all levels, but the tunneling values of hv represent the
tunneling frequencies in the nonrotating molecule for each symmetrically inequivalent
tunneling path. The nontunneling values of hj, hk, and f correspond physically to
the usual asymmetric-rotor rotational constants  ,
,
 , and
, and
 , while
the tunneling values of hj, hk, and f correspond to tunneling
corrections to these rotational constants. The f(2) parameters correspond to tunneling
and nontunneling contributions to the asymmetric-rotor ΔK = 4 term of the
Hamiltonian. The linear terms q and r in Eq. (1) correspond physically to the
interaction of components of the total angular momentum with any angular momentum
generated in the molecule-fixed axis system by the two large amplitude motions in the
molecule. Only tunneling contributions for these linear terms are allowed in the
Hamiltonian. The nontunneling quadratic s term allows physically for the fact that the
molecule-fixed components Jx, Jy, and Jz of the total angular
momentum J
are not expressed in the principal-axis system of the molecule since partial internal axis
method is used to set up the Hamiltonian.
, while
the tunneling values of hj, hk, and f correspond to tunneling
corrections to these rotational constants. The f(2) parameters correspond to tunneling
and nontunneling contributions to the asymmetric-rotor ΔK = 4 term of the
Hamiltonian. The linear terms q and r in Eq. (1) correspond physically to the
interaction of components of the total angular momentum with any angular momentum
generated in the molecule-fixed axis system by the two large amplitude motions in the
molecule. Only tunneling contributions for these linear terms are allowed in the
Hamiltonian. The nontunneling quadratic s term allows physically for the fact that the
molecule-fixed components Jx, Jy, and Jz of the total angular
momentum J
are not expressed in the principal-axis system of the molecule since partial internal axis
method is used to set up the Hamiltonian.
According to the energy level labeling scheme adopted for methylamine in Ohashi et al. (1987), each energy level is labeled by the value of the usual quantum numbers J and K = Ka and by an overall torsion-wagging-rotation symmetry species Γ corresponding to an irreducible representation of the permutation-inversion group G12: A1, A2, B1, B2, E1, E2. The symmetry labels of doubly degenerate levels E1 and E2 have additional ± 1 labels to distinguish between two levels with the same J and Ka (see discussion by Ohashi et al. 1987). For the Ka = 0 levels, the + 1 and −1 labels have no meaning since there is only one E1 or E2 level. Since the choice is arbitrary, we have designated all Ka = 0E levels as +1 levels.
The computer fitting program used in the present analysis of the rotational spectrum of methylamine was developed by N. Ohashi (Ohashi et al. 1987) and previously modified by V. Ilyushin who added new Hamiltonian terms (Ilyushin et al. 2005) and provided the line strength calculations (Ilyushin & Lovas 2007). In the present study the program was subjected to a number of further modifications. In addition to expanding different array dimensions with the aim of providing calculations for J quantum numbers above J = 30 and a number of modifications undertaken with the aim of speeding up the code, new higher order centrifugal distortion corrections to the ρ parameter (ρJJ, ρJK, and ρKK) were included into the program code. From these parameters ρJJ, and ρJK are determined in the current study. Also we have used a new labeling procedure in the program since the previous labeling procedure was based on searching for the dominant component in basis-set composition of eigenvectors and not for all eigenstates above J = 30 it was possible to find such a component. Therefore the labeling scheme based on searching for similarities in basis-set composition in eigenvectors belonging to adjacent J values described by Ilyushin (2004) was used.
Methylamine has two nonzero dipole moment components μa = −0.307 D and μc = 1.258 D. The symmetry selection rules are the following: A1 ↔ A2, B1 ↔ B2, E1 ↔ E1, E2 ↔ E2. Whereas in the framework of the high-barrier tunneling formalism used for methylamine there are both tunneling and nontunneling contributions to the dipole moment matrix elements, we do not have any information on the tunneling contributions and therefore the calculations were done taking only non-tunneling contributions into account (permanent dipole moment components). It should be noted that the observed line intensities are reproduced rather well by nontunneling contributions of dipole moment matrix elements.
Molecular parameters of the ground torsional state of methylamine.
3.2. Assignment and analysis
The assignment procedure was rather straightforward because of relatively sparse spectra, good signal-to-noise ratio for the majority of the ground state lines, and good predictions obtained for the frequency range above 500 GHz from the set of parameters in the paper by Ilyushin & Lovas (2007). First we proceeded with the assignment of all the lines with J < 30, which was the upper J limit of the previous work (Ilyushin & Lovas 2007). Most of these rotational transitions were predicted within the 0.5 MHz vicinity of the actual line positions. Only a few transitions, with J = 26...30, exhibited initial “obs-calc” deviations up to 1.2 MHz. As the next step, we extended our analysis to transitions involving higher values of J > 30. Indeed, after the J < 30 assignment was complete the observed spectra still contained many strong unassigned lines that could be attributed to the ground vibrational state. This was especially evident in the case of cQ-type transitions. A new prediction with J ≤ 50 was generated and the transitions with J up to 45 were assigned in the recorded spectra. Additionally, several J > 30 rotational transitions were assigned in the millimeter-wave spectra records obtained in the previous study of methylamine (Ilyushin et al. 2005). A portion of the observed rotational spectrum of methylamine around 890 GHz is shown in Fig. 1 and compared to the predicted rotational spectrum in the ground vibrational state. As can be seen from Fig. 1 the overall correspondence between experimental and theoretical spectra is very good. Particularly in this spectral region, the observed spectrum is dominated by cQ-type series of transitions with Ka = 6 ← 5, but also another Q-type series, presumably in the first excited torsional state (268 cm-1 above the ground state), can be distinguished.
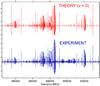 |
Fig. 1 Predicted (in red) and observed (in blue) rotational spectrum of methylamine between 876 and 905 GHz dominated by cQ-type series of transitions with Ka = 6 ← 5. A slight inconsistency between predicted and observed spectrum, that may be visible for some strong lines, is due to source power and detector sensitivity variations. |
Measured rotational transitions of methylamine in the ground vibrational state (a part of the table available at the CDS).
Predicted transitions of methylamine in the ground vibrational state (a part of the table available at the CDS).
The relatively narrow linewidths below 1 THz enable resolution of nuclear quadrupole hyperfine splittings for more than 200 rotational transitions. The hyperfine structure was resolved even for relatively high-J transitions up to J = 44. Only the most intense hyperfine components with the ΔF = ΔJ selection rule were observed. Typically a resolved pattern of the hyperfine structure was observed as a doublet with an approximately 2-to-1 ratio in intensities. The stronger doublet component contains unresolved hyperfine transitions with selection rules F = J + 1 → F′ = J′ + 1 and F = J − 1 → F′ = J′ − 1, whereas the weaker doublet component corresponds to the F = J → F′ = J′ transition. To provide hyperfine-free frequencies used in our analysis of the rotation-torsion-wagging spectrum of the ground state of methylamine, we fit the frequencies of the individual hyperfine components using the model described in the paper by Ilyushin et al. (2005). In the fit we also used previously available data on the methylamine quadrupole hyperfine splittings (Ilyushin et al. 2005). The quadrupole hyperfine parameters χ+, and χ− obtained from the fitting of the hyperfine patterns of the rotational transitions are presented in Table 1.
In total, the new dataset for the rotational spectrum of the ground state of methylamine includes 2558 microwave and 785 far-infrared transitions. Here we use terms “microwave” and “far infrared” to distinguish between the measurements obtained using the methods of conventional absorption spectroscopy and Fourier transform spectroscopy, although in fact the frequency range of our current “microwave” measurements overlap with “far infrared” measurements of the previous paper (Ilyushin & Lovas 2007), and we were able to remeasure 65 far infrared transitions in our current work improving thus the measurement accuracy for these transitions by at least two orders of magnitude. Compared to the previous paper by Ilyushin & Lovas (2007), 1849 new microwave transitions were included in the dataset as a result of the present study. The details of the weighting scheme of the previous measurements are described in papers by Ilyushin et al. (2005) and Ilyushin & Lovas (2007).
The set of 3343 rotational transitions in the ground vibrational state of methylamine was fitted to the theoretical model described above. The fit adopted in the present study as the “best” achieved the rms deviation of 0.094 MHz for microwave transitions and 0.00029 cm-1 for FIR transitions. The weighted rms deviation of the fit was 0.87. It was obtained with 76 parameters, whereas 53 parameters were used in the last two previous studies. The values of the molecular parameters obtained from the final fit are presented in Table 1. Comparison of Table 1 in Ilyushin & Lovas (2007) and Table 1 here shows that the new parameters correspond to the higher order centrifugal distortion corrections of the rotational and torsional-wagging tunneling parameters, as might be expected a priori.
The list of measured rotational transitions of the ground vibrational state of methylamine is presented in Table 2. It includes the rotational transition frequencies obtained in this study as well as those available from previous studies. In the first six columns of Table 2, the quanta for each spectral line are given: J, Ka, and symmetry label Γ. In the following columns we provide the observed transition frequencies, measurement uncertainties, residuals from the fit, and the reference from which the measurements were obtained. Only hyperfine free rotational frequencies that were used in the final fit are presented in Table 2 for the observed transitions. Table 3 predicts the ground state rotational spectrum of methylamine up to 3 THz. The spectrum was calculated taking nuclear quadrupole hyperfine structure into account . Therefore each energy level in Table 3 is labeled by four quantum numbers: J, Ka, Γ, and total angular momentum F. The quantum numbers are followed by the columns with calculated transition frequencies and corresponding uncertainties. The next two columns contain the product μ2S, and the nuclear spin statistical weight which is equal to 1 for A1, A2 and E2 species and equal to 3 for B1, B2 and E1 species. The next column represents the energy of the lower state. Owing to their significant sizes, the complete versions of Tables 2 and 3 are presented at the CDS. Here only parts of Tables 2 and 3 are given for illustration purposes.
Since the highest J and Ka values accessed in our experimental study were J = 45 and Ka = 19, the limitation of J = 50, Ka = 20 was adopted for our prediction. We have included in the calculation the rotational transitions with rotational selection rules J = 0, ± 1 and Ka = 0, ±1, ±2, ±3. In Table 3, those transitions that match the frequency range requirement (from 1 GHz to 3 THz) and whose predicted uncertainties are less than 1 MHz, and line strength exceeds the limit of 0.01 are included. Also, to limit the size of Table 3, we have only presented the most intense hyperfine quadrupole components for which the relative intensities exceeded 0.1% of the total intensity of the rotation transition (i.e., mainly with the selection rule ΔF = ΔJ). In addition we provide the rotational part of the partition function Qr(T) of methylamine calculated from first principles (Table 4), i.e. via direct summation over the rotational-tunneling states. The maximum value of the J quantum number for the energy levels taken for calculating the partition function is 100. The vibrational part Qv(T) may be estimated in the harmonic approximation using the normal modes reported by Shimanouchi (1972). Simple formulas for calculating Qv(T) can be found elsewhere (see, for example, Gordy & Cook 1984).
To get an estimate of how the observed deviations from the predicted positions may correlate with predicted uncertainties we compared the predicted uncertainties and transition frequencies calculated using the Hamiltonian parameters of Ilyushin & Lovas (2007) with actual line positions for the new lines measured in our current work. The highest obs.-calc. value (about 34 MHz) was found for the 44 3 B2 → 44 2 B1 transition which frequency was predicted (based on the results of Ilyushin & Lovas 2007) with the uncertainty of 3.2 MHz thus giving a ratio of ten between observed deviation and predicted uncertainty. Comparison for other newly measured transitions more or less satisfies this upper limit on the correlation between observed deviations and predicted uncertainties. The gap between predicted uncertainties and actual deviations from the prediction is quite understandable since the uncertainties do not account for the extension of the model needed to describe higher J and Ka transitions adequately. Presumably, the value of this gap is determined by the extrapolation distance and by a level of nonrigidity of a molecule. The extrapolation from J = 45 to J = 50 in our current spectrum prediction is less strained than the example considered above of extrapolation from J = 30 to J = 45, and therefore we might expect better correspondence between predicted uncertainties and actual deviations for the newly predicted transition frequencies.
4. Conclusions
A new study of the ground state rotational spectrum was carried out in a wide frequency range up to 2.6 THz. The study represents an almost fivefold expansion in terms of frequency range coverage for the rotational spectrum of methylamine. Although we have not discovered any significant discrepancies between the ground state spectra observed and predicted on the basis of the last results by Ilyushin and Lovas, 21 new parameters of the Hamiltonian were added into the model in order to achieve the fit within experimental accuracy. The inclusion of new parameters is explained by the extension of the model for transitions involving J > 30, and also by the fact that a number of far-infrared transitions were remeasured with microwave precision. The results of the present study allow us to produce reliable predictions of the ground state transition frequencies of the methylamine molecule for astrophysical purposes in the frequency range up to 3 THz for 0 < J < 50 and 0 < Ka < 20.
Acknowledgments
The authors are indebted to Dr. N. Ohashi for providing his fitting program for methylamine. This work was done with the support of the Ukrainian-French CNRS-PICS 6051 project. Portions of this research were carried out at the Jet Propulsion Laboratory, California Institute of Technology, under contract with the National Aeronautics and Space Administration.
References
- Belloche, A., Müller, H. S. P., Menten, K., Schilke, P., & Comito, C. 2013, A&A, 559, A47 [NASA ADS] [CrossRef] [EDP Sciences] [Google Scholar]
- Bossa, J.-B., Duvernay, F., Theulé, P., et al. 2009, A&A, 506, 601 [NASA ADS] [CrossRef] [EDP Sciences] [Google Scholar]
- Drouin, B. J., Maiwald, F. W., & Pearson, J. C. 2005, Rev. Sci. Instrum., 76, 093113 [Google Scholar]
- Ehrenfreund, P., Bernstein, M. P., Dworkin, J. P., Sandford, S. A., & Allamandola, L. J. 2001, ApJ, 550, L95 [NASA ADS] [CrossRef] [Google Scholar]
- Fourikis, N., Takagi, K., & Morimoto, M. 1974, ApJ, 191, L139 [NASA ADS] [CrossRef] [Google Scholar]
- Glavin, D. P., Dworkin, J. P., & Sandford, S. A. 2008, Met. Planet. Sci., 43, 399 [Google Scholar]
- Gordy, W., & Cook, R. L. 1984, Microwave Molecular Spectra, Techniques of Chemistry, Vol. XVIII (New York: Wiley) [Google Scholar]
- Halfen, D. T., Iyushin, V. V., & Ziurys, L. M. 2013, ApJ, 767, 66 [NASA ADS] [CrossRef] [Google Scholar]
- Hirakawa, H., Miyahara, A., & Shimoda, K. 1956, J. Phys. Soc. Jpn., 11, 334 [NASA ADS] [CrossRef] [Google Scholar]
- Holtom, P. D., Bennett, C. J., Osamura, Y., Mason, N. J., & Kaiser, R. I. 2005, ApJ, 626, 940 [NASA ADS] [CrossRef] [Google Scholar]
- Ilyushin, V. V. 2004, J. Mol. Spec., 227, 140 [NASA ADS] [CrossRef] [Google Scholar]
- Ilyushin, V., & Lovas, F. J. 2007, J. Phys. Chem. Ref. Data, 36, 1141 [NASA ADS] [CrossRef] [Google Scholar]
- Ilyushin, V. V., Alekseev, E. A., Dyubko, S. F., Motiyenko, R. A., & Hougen, J. T. 2005, J. Mol. Spectr., 229, 170 [NASA ADS] [CrossRef] [Google Scholar]
- Kaifu, N., Morimoto, M., Nagane, K., et al. 1974, ApJ, 191, L135 [NASA ADS] [CrossRef] [Google Scholar]
- Kreglewski, M. 1989, J. Mol. Spectr., 133, 10 [NASA ADS] [CrossRef] [Google Scholar]
- Kreglewski, M., & Wlodarczak, G. 1992, J. Mol. Spectr., 156, 383 [NASA ADS] [CrossRef] [Google Scholar]
- Kreglewski, M., Stahl, W., Grabow, J.-U., & Wlodarczak, G 1992, Chem. Phys. Lett., 196, 155 [NASA ADS] [CrossRef] [Google Scholar]
- Lee, C.-W., Kim, J.-K., Moon, E.-S., Minh, Y. C., & Kang, H. 2009, ApJ, 697, 428 [NASA ADS] [CrossRef] [Google Scholar]
- Lide, Jr., D. R. 1954, J. Chem. Phys., 22, 1613 [NASA ADS] [CrossRef] [Google Scholar]
- Muller, S., Beelen, A., Guelin, M., et al. 2011, A&A, 535, A103 [NASA ADS] [CrossRef] [EDP Sciences] [Google Scholar]
- Nishikawa, T. 1957, J. Phys. Soc. Jpn., 12, 668 [NASA ADS] [CrossRef] [Google Scholar]
- Ohashi, N. & Hougen, J. T. 1987, J. Mol. Spec., 121, 474 [NASA ADS] [CrossRef] [Google Scholar]
- Ohashi, N., Takagi, K., Hougen, J. T., Olson, W. B., & Lafferty, W. J. 1987, J. Mol. Spectr., 126, 443 [NASA ADS] [CrossRef] [Google Scholar]
- Pearson, J. C., Drouin, B. J., Maestrini, A., et al. 2011, Rev. Sci. Instrum., 82, 093105 [NASA ADS] [CrossRef] [PubMed] [Google Scholar]
- Schimanouchi, T. 1972, in Tables of Molecular Vibrational Frequencies, Vol. I: consolidated (Washington, DC: National Bureau of Standards ), 67 [Google Scholar]
- Shimoda, K., Nishikawa, T., & Itoh, T. 1954, J. Phys. Soc. Jpn., 9, 974 [NASA ADS] [CrossRef] [Google Scholar]
- Takagi, K., & Kojima, T. 1971, J. Phys. Soc. Jpn., 30, 1145 [NASA ADS] [CrossRef] [Google Scholar]
- Takagi, K., & Kojima, T. 1973, ApJ, 181, L91 [NASA ADS] [CrossRef] [Google Scholar]
All Tables
Measured rotational transitions of methylamine in the ground vibrational state (a part of the table available at the CDS).
Predicted transitions of methylamine in the ground vibrational state (a part of the table available at the CDS).
All Figures
|
Fig. 1 Predicted (in red) and observed (in blue) rotational spectrum of methylamine between 876 and 905 GHz dominated by cQ-type series of transitions with Ka = 6 ← 5. A slight inconsistency between predicted and observed spectrum, that may be visible for some strong lines, is due to source power and detector sensitivity variations. |
| In the text | |
Current usage metrics show cumulative count of Article Views (full-text article views including HTML views, PDF and ePub downloads, according to the available data) and Abstracts Views on Vision4Press platform.
Data correspond to usage on the plateform after 2015. The current usage metrics is available 48-96 hours after online publication and is updated daily on week days.
Initial download of the metrics may take a while.