Fig. 8
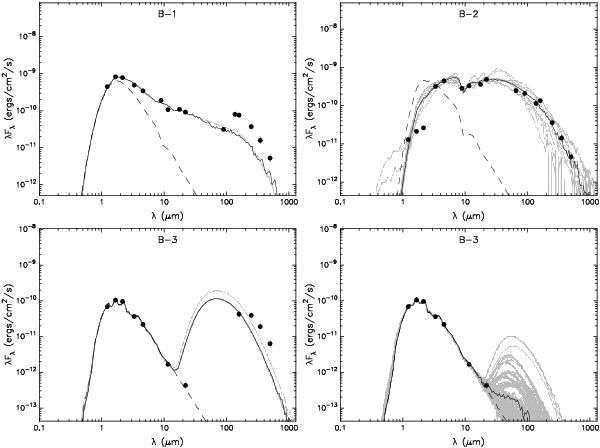
SEDs of the sources B-1, B-2, and B-3, fitted with the YSO models of Robitaille et al. (2007). Filled circles show the
fitted 2MASS (J, H, Ks), WISE (3.4, 4.6, 12.0, 22.2
μm),
AKARI (only for B-1 and B-2) and Herschel (Getsources: 160, 250,
350, 500 μm) fluxes shown in Table 2. Error bars are shown, but they are often
smaller than the data points. The solid black line shows the best-fitting model, and
the possible grey lines show the models that fit the criteria
 , where
 is the
χ2 value per data point of the
best-fitting model (for B-1 and B-3), or the ten best models (B-2). The dashed line
shows the stellar photosphere of the best-fitting model. (Bottom
right) B-3 fitted with only NIR–MIR data and using a wide distance range
(20–800 pc).
is the
χ2 value per data point of the
best-fitting model (for B-1 and B-3), or the ten best models (B-2). The dashed line
shows the stellar photosphere of the best-fitting model. (Bottom
right) B-3 fitted with only NIR–MIR data and using a wide distance range
(20–800 pc).

Current usage metrics show cumulative count of Article Views (full-text article views including HTML views, PDF and ePub downloads, according to the available data) and Abstracts Views on Vision4Press platform.
Data correspond to usage on the plateform after 2015. The current usage metrics is available 48-96 hours after online publication and is updated daily on week days.
Initial download of the metrics may take a while.