Fig. 12
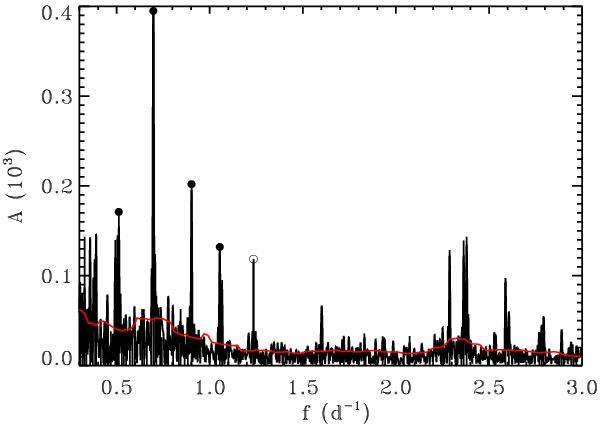
Frequency spectrum in the γ Dor domain after prewhitening with the first twelve frequencies of Table B.1. The highest amplitude peak corresponds to f13 ≃ 18forb. The gray (red) line is the estimate of local noise by PERIOD04 (with a box of 0.2 d-1). The black dots denote the values used to derive the period spacing. The open circle denotes the frequency f193 = 1.2350 d-1, which according to that period spacing value has nf193 = 39. This last frequency is also very close to 32forb.
Current usage metrics show cumulative count of Article Views (full-text article views including HTML views, PDF and ePub downloads, according to the available data) and Abstracts Views on Vision4Press platform.
Data correspond to usage on the plateform after 2015. The current usage metrics is available 48-96 hours after online publication and is updated daily on week days.
Initial download of the metrics may take a while.