Fig. 20
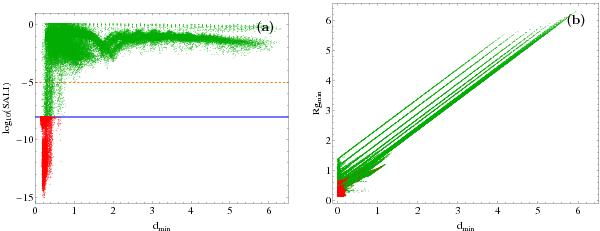
a)Left: minimum distance of orbits to the origin versus SALI. The horizontal, blue line shows the limit separating ordered from chaotic orbits. All the orbits between the two horizontal lines (orange and blue) are probably sticky orbits, which require more than 104 time units of integration time, so as to reveal their true chaotic nature. b)Right: minimum distances of orbits to the origin versus minimum distances to the minimum of the effective potential, located at (Rg,0). Green color corresponds to regular motion, while red corresponds to chaotic.
Current usage metrics show cumulative count of Article Views (full-text article views including HTML views, PDF and ePub downloads, according to the available data) and Abstracts Views on Vision4Press platform.
Data correspond to usage on the plateform after 2015. The current usage metrics is available 48-96 hours after online publication and is updated daily on week days.
Initial download of the metrics may take a while.