Fig. 19
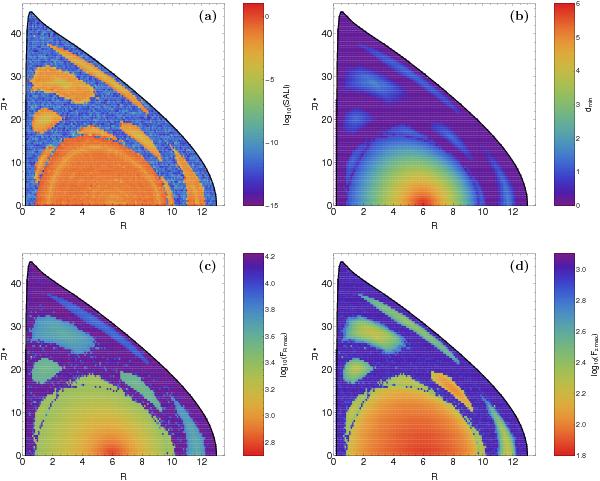
Grids of initial conditions  at
the Mn = 250 OH galaxy model. Each point
is colored according to its a) upper left: SALI value,
b)upper right: minimum distance to the origin
dmin, c) lower
left: maximum force along the R direction FRmax, and d)
lower right: maximum force along the z direction
Fzmax.
at
the Mn = 250 OH galaxy model. Each point
is colored according to its a) upper left: SALI value,
b)upper right: minimum distance to the origin
dmin, c) lower
left: maximum force along the R direction FRmax, and d)
lower right: maximum force along the z direction
Fzmax.
Current usage metrics show cumulative count of Article Views (full-text article views including HTML views, PDF and ePub downloads, according to the available data) and Abstracts Views on Vision4Press platform.
Data correspond to usage on the plateform after 2015. The current usage metrics is available 48-96 hours after online publication and is updated daily on week days.
Initial download of the metrics may take a while.