Free Access
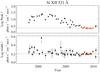
Fig. 9
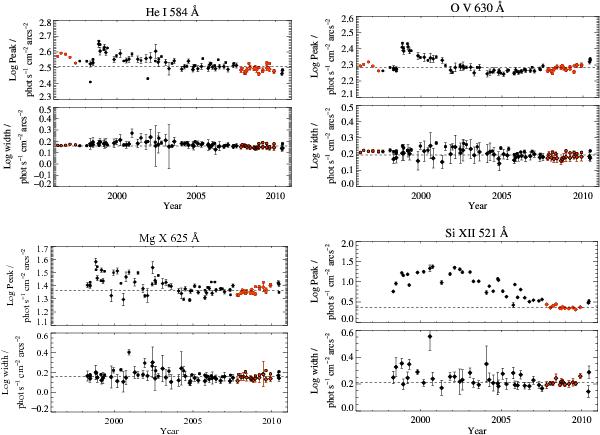
Fit parameters of the QS or lowest-radiance component of the radiance histograms for four representative lines. Filled diamonds and circles denote USUN and SYNOP mosaics, respectively. The data points used to compute the average values of Table 2 are marked in red.
This figure is made of several images, please see below:
Current usage metrics show cumulative count of Article Views (full-text article views including HTML views, PDF and ePub downloads, according to the available data) and Abstracts Views on Vision4Press platform.
Data correspond to usage on the plateform after 2015. The current usage metrics is available 48-96 hours after online publication and is updated daily on week days.
Initial download of the metrics may take a while.