| Issue |
A&A
Volume 563, March 2014
|
|
|---|---|---|
| Article Number | A38 | |
| Number of page(s) | 6 | |
| Section | Planets and planetary systems | |
| DOI | https://doi.org/10.1051/0004-6361/201322776 | |
| Published online | 03 March 2014 | |
The colour of the dark side of the Moon
1
Danish Climate Centre at DMI, Lyngbyvej 100,
2100
Copenhagen Ø,
Denmark
2
Centre for Astrophysics and Supercomputing, Swinburne
University, Hawthorn
VIC
3122,
Australia
3
Lund Observatory, Lund, Sweden
4
Departamento de Física Aplicada, Universidade de
Vigo, Campus Lagoas-Marcosende
s/n, 36310
Vigo,
Spain
5
Department of Physics, Faculty of Science, University of
Zanjan, Zanjan,
Iran
6
Leiden Observatory, Leiden University,
PO Box 9513, 2300 RA
Leiden, The
Netherlands
Received: 2 October 2013
Accepted: 10 January 2014
Abstract
Aims. “Earthshine” is the dim light seen on the otherwise dark side of the Moon, particularly when it is close to new. “Earthlight”, or reflected sunlight from the Earth, is the source of Earthshine. Using B and V band CCD images of both the dark and bright sides of the Moon, we aim to estimate the Johnson photometry B − V colour of the Earthshine for the first time since the late 1960s. From these measurements we are also able to quantify the colour of Earthlight.
Methods. We present images of the Moon taken with a small refractor in Hawaii, in B and V bands and taken under favourable conditions so that scattered light in both bands almost completely cancels, yielding a map of the surface in B − V colour. Co-addition of 100 such images taken in rapid succession substantially improves the signal-to- noise ratio, and several sources of photometric bias are eliminated by use of relative methods.
Results. The earthlit dark side of the Moon is observed to be 0.150 ± 0.005 mag bluer in B − V than the sunlit bright side, in good agreement with the only known previous measurement of this quantity from 1967. Arguing on the basis of the change in B − V for sunlight reflected once off the Moon, we derive a colour for earthlight of B − V = 0.44 ± 0.02 mag (without applying a small, uncertain, phase-dependent reddening correction). The absence of a colour-gradient in the B − V image implies that the scattering properties of the atmosphere+optical system are almost exactly matched in the two wavelength bands, the consequences of which are discussed.
Key words: atmospheric effects / Earth / techniques: image processing / techniques: photometric / planets and satellites: surfaces / Moon
© ESO, 2014
1. Introduction
The study of the photometric properties of the lunar surface is in a phase of rapid development through both ground-based (e.g. Velikodsky et al. 2011) and space-borne (e.g. Yokota et al. 2011, 2012; Boyd et al. 2012) instruments. Absolute photometry of the sunlit Moon (hereafter BS for the bright side) can be used to calibrate satellite borne instruments – notably Earth-observing satellites (Stone 2008), and is an important means of ensuring long-term stability in data products, such as used for climate studies.
The so-called dark side of the Moon (hereafter DS) is almost always illuminated by some fraction of the Sun-lit Earth. This light is called Earthshine, and is to be distinguished from its source, which we hereafter refer to as Earthlight.
Photometry of the bright and dark sides of the Moon can be used to measure/monitor the changing albedo of the Earth. Pioneering photometer-based work in this field was undertaken already in the 1930s (Danjon 1933; Dubois 1943), and also later (Bakos 1964; Rydgren 1966). Modern studies, utilizing CCDs, date from the work of Goode et al. (2001), who show that albedo studies of the Earth can be performed from the Earth, with accuracies rivalling satellites and precisions limited mainly by the Earth’s natural albedo variability. A global network of about half a dozen small telescopes could in principle monitor Earth’s changing albedo via Earthshine photometry rather cheaply, and with much better long term stability, than satellites (Flatté et al. 1992).
Satellite measurements of visual-band fluxes from the CERES and ERBE instruments have shown (Bender et al. 2006) that the global-mean annual cycle in monthly-mean albedo has an amplitude of about 3% of the mean value. Shorter-term variations can be larger – in GERB full-disc images at 15 min intervals, it was found (Øelund 2013) that at quarter phase albedo varied by 20%, due to changing cloud masses.
Earthshine telescopes currently in use are strongly motivated by the design made at Big Bear Solar Observatory (Goode et al. 2001, 2010) and collaborators. Telescopes of this type are currently operating from Tenerife and the Crimea. The instruments are small (few cm aperture) automatically operating refractors, which image the Moon and the surrounding sky on a suitable scale (near 1° × 1°).
The essential observational issues to be solved are, firstly, the reduction and/or removal of the significant light scattering, arising partly in the atmosphere, but mainly in the optical train of the telescope/detector; and secondly, the high contrast ratio between the BS and DS, which typically is not much less than the dynamic range of the imaging (CCD) device.
The telescopes typically consist of a primary lens and secondary optics designed to allow the insertion of a Lyot-stop, to eliminate divergent light rays (Lyot 1939; Noll 1973), along with a means of inserting optical band- or neutral density-filters, and a shutter at the pupil. They also typically use high quality bi-element objectives (in order to limit the number of optical surfaces) and occulting devices near the prime focus with which to cover the BS. A typical occulting device is a knife-edge that can be manually or automatically positioned in the field of view. Such devices suppress the light entering the rest of the optical system, at the cost of producing a bright field of forward-scattered light within the telescope.
Since such a device adds complexity to operational procedures, while not altogether eliminating the need for subsequent numerical modelling of the scattered light, we have considered doing without it. Numerical modelling of scattered light may be unavoidable in the bulk of earthshine observations, but attention to optical design, internal baffling and identifying excellent observing conditions can also give interesting results. We find ourselves with data from a rare and special night where the data show unique properties, and discuss these here.
We have operated our own equatorially mounted earthshine refractor (Owner-Petersen et al. 2008; Darudi et al. 2010), from National Oceanic and Atmospheric Administration’s observatory on Mauna Loa (3397 m altitude) in Hawaii, during 2011 and 2012, acquiring 500+ image sequences of the Moon in 5 broad-band filters – amongst them Johnson B and V. Our imager is an Andor DU897-BV camera based on a sensitive back-illuminated thinned CCD chip (512 × 512 pixels, pixel size of 16 μm and image scale 6.67 arcsec per pixel, field of view is just under 1 × 1 degree of arc). The detector is cooled thermostatically by a Peltier element.
In this paper, we present B and V band imaging data of the Moon taken with our Earthshine telescope, under unique atmospheric conditions in which the scattered halos in B and V light cancelled so well as to yield a B − V colour map of the lunar surface with virtually no residual scattered-light colour gradient. This map has been used to measure the colour of Earthshine on the DS, and sunlight on the BS, as a means of estimating the colour of Earthlight.
We believe this to be the only recent determination of the dark side’s Johnson B − V colour, since the late 1960s.
2. Observations and data reductions
The waning crescent Moon was observed on JD 2 455 945.177 (16:00 UTC, January 18, 2012) at an airmass of z ~ 1.5 with an illuminated fraction of close to 0.25; lunar phase near 40°. Image stacks of 100 consecutive 55 ms images in V and 155 ms in B, along with bias frames immediately before and after the stacks, were exposed. Flat field images in B and V were acquired from a Hohlraum lamp source mounted on the dome wall. The flat fields originally had some smooth spatial gradients near the edge which were removed by subtraction of a fitted low-order polynomial surface after which the mean level was added back. Hundreds of images had been obtained in both bands and averaged. Flat field noise is thus low and the flat fields are dominated by dust speck signatures and a fixed diagonal pattern probably due to CCD thinning.
The bias level in the CCD oscillates by about 0.25% over a 20-min period due to the Peltier cooling element. To remove this, we create a superbias image from hundreds of bias images that were averaged, using the mean half-median technique on each pixel, to yield a very low-noise image of the bias. Bias frames taken before and after science frames could then be used to scale the superbias to the appropriate level. This procedure proved very satisfactory. The science frames were bias-subtracted, flat fielded following standard techniques, and then converted to fluxes by dividing by the exposure times.
Although atmospheric extinction coefficients were not measured on the night of the observations, long term monitoring of extinction during the project has yielded values of kB = 0.17 and kV = 0.08. These coefficients are needed to set the zero point of the photometry, but have no effect on the colour difference of the DS and BS, since they factor out.
Transformations from instrumental to Johnson B and V were derived from observations of the open cluster NGC 6633 (RA = 18h 37m and Dec = +06 34, J2000), for which colours and magnitudes are available in the WEBDA Open Cluster database1. This cluster was very convenient, because (1) it is 20 arcmin across, ideal for our camera’s field of view; (2) it is young (<1 Gyr), so there is a wide range of colours amongst the stars, from 0 < B − V < 2.0; and (3) the stars are relatively bright (V < 12) and can be reached in less than a minute in B and V. Photometry in UBV is available in Hiltner et al. (1958) for 95 stars with V < 12, and these stars were located in our images and transformations obtained to the standard Johnson system. The estimated accuracy of the V magnitudes in Hiltner et al. (1958) is ± 0.012 mag and in B − V colour it is ± 0.006 mag. Averaging over 95 stars leads to a very precise calibration. The scatter of the transformations is about 0.02 mag, while the zero-point is set to better than 0.01 mag.
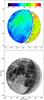 |
Fig. 1 B − V image (upper panel) of the waning crescent Moon on JD 2 455 945.177. False colours represent B − V values; the DS is blue and to the left of the image; the bar shows B − V and corresponding colours. The finder chart (lower panel) shows the measurement areas in Mare Crisium and Oceanus Procelarum. Subtle colour differences, corresponding to M. Crisium, M. Fecunditatis, M. Nectaris, Tycho and adjoining M. Nubium can be recognized using the finder chart. Lines of equal longitude and latitude are drawn at 30° intervals. Eastern longitudes are to the left of the images. A colour version of this figure is available online. |
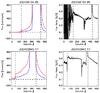 |
Fig. 2 Row-slices across the Moon, through disc centre, on two nights, to illustrate halo profiles and intensities. The upper row is from a night when the B and V halos did not cancel, while the lower row is from the unique night JD 2 455 945.17, when the halos did cancel on the DS part of the lunar disc. The left column shows profiles (B is in blue, and V is in red; V is the upper profile), while the right column shows the B/V flux ratio. Horizontal dashed line shows the zero flux level. Vertical dashed lines show the disc edges. Orientation of DS and BS are as in Fig. 1. A colour version of this figure is available online. |
The lunar images were carefully aligned, as miss-alignment tends to leave surface-feature patterns and residual light of the two halos (i.e. scattered light) in B and V in the colour map. Optimal alignment was found by using a combination of visual inspection and correlation methods. Typical standard deviation of the alignment errors are at the sub-pixel level; worst-case misalignments above half a pixel are easily caught by visual inspection. Given the plate-scale, we estimate alignment errors to be 1−2 arcsec generally, 3 arcsec at worst. In terms of degrees of lunar longitude these numbers correspond to 0.2°, at most. The disadvantage of using a method based on co-adding 100 aligned images is that the signal-to-noise ratio (S/N) is not quite as high as that available using an occulting device – we expect a single well-exposed image taken with such a device covering the bright side to have a DS S/N five times higher than what is possible with 100 co-added short exposures. Alignment of images is possible to a satisfactory degree, but the limited resolving power of our optical system spreads the light from e.g. bright lunar highlands into darker mare, making use of the co-located selenographic coordinate system, and choice of lunar regions for photometry, critical. The disadvantages could be countered by using a faster optical system with better resolving power and a camera with a larger buffer and faster image download speed. The advantage of the co-addition technique is that a symmetric ray path is maintained so that an axially asymmetric scattered light field inside the telescope/camera system is avoided.
Colours were measured on the dark and bright sides at particular regions of the surface, which were extracted from the pixel space images on the basis of a selenographic coordinates. The mapping between image pixel positions and the selenographic coordinate system is possible with the ephemerides and some geometry. We selected regions centered on those used by Franklin (1967): that is, Mare Crisium at 18° N, 60° E, and Oceanus Procelarum at 19° N, and 60° W. Photometry was performed at these coordinate centers for rectangular apertures of sizes from plus/minus 1 to plus/minus 5 selenographic degrees (in longitude and latitude). We determined an optimal size of plus/minus 3 degrees. Larger apertures tended to erroneously include a few pixels from adjoining, higher or lower luminosity lunar areas; smaller apertures contained fewer pixels and noise averaging suffered.
The mean values in each subregion, and the standard deviation of that mean were obtained by bootstrap sampling (5000 times) with replacement (Efron & Tibshirani 1993) on the pixels contained in the sub-images.
A calibrated false-colour B − V image of the Moon is shown in Fig. 1. There is almost complete cancellation between the halos of BS-scattered light in the B and the V bands. In Fig. 2 details of the halo profiles on this night, and a night where halos do not cancel, are shown. The night JD 2 455 945.17 is mediocre in terms of the strength of scattering in the atmosphere – the other night shown is much clearer, but on that night the halos do not cancel. The cancellation is an as-yet poorly understood interplay of halo profiles and intensities dictated by lunar phase and atmospheric conditions.
In Table 1 we give calibrated magnitudes from selected regions (see notes at end of table for details) in the B and V images seperately, along with B − V calculated from the same regions in the B − V image directly. We see that the difference between B and V magnitudes is the same as B − V found in the B − V image, but that the errors of the former difference is larger than the latter. This constitues a sanity check on the data. B − V for the same regions extracted in a Full Moon image from JD 2 455 814 were also extracted so that the intrinsic surface colour-differences between the two regions could be estimated – results likewise in Table 1.
The literature since the late 1960s contains discussions of how much lunar colour depends on the phase angle; the dependence is low but can be measured (McCord 1969; Velikodsky & Volvach 2011). Observations, from the ground and from lunar orbiters, of lunar reddening in B − V can be extrapolated to the relevant phase for our observation (DS near 0 degree phase, BS at 40 degrees phase) and yields a suggested reddening of at least 0.06 mag of the DS-to-BS observation. Observations of the phase-dependent reddening of lunar colours, since it was first noticed and until now, do not agree on the magnitude of the effect, only the sign – e.g. compare McCord (1969) and Lane & Irvine (1973). Since we wish to compare to Franklin (1967), who did not apply any phase-dependent corrections, nor do we. Franklin’s set of observations cover phase angles from 32 to 78 degrees, spanning our single observation. There is no hint of any phase dependence in B − V, but the scatter in Franklin’s B − V data is of the same order of magnitude as the expected reddening.
Observed results.
The colour of the Sun has been determined indirectly using Sun-like stars by (Holmberg et al. 2006), who obtain (B − V)⊙ = 0.64 ± 0.02 mag. Another method to determine the colours of the Sun is by applying synthetic photometry to the observed, absolute flux calibrated solar spectrum; this results in (B − V)⊙ = 0.63−0.65 (Colina et al. 1996; Bessell et al. 1998), in good agreement with the Holmberg et al. (2006) value. For the BS (which is illuminated directly by the Sun), we derive a colour of 0.90 ± 0.01 mag: thus, the Moon reddens the Solar spectrum by 0.90−0.64 = 0.26 mag, on average. If we assume the same reddening of the Earthlight when it reflects from the Moon as Earthshine, we derive an apparent colour for Earthlight on this particular night of B − V = 0.75−0.26 = 0.49 ± 0.02 mag. The uncertainty given is dominated by the uncertainty on (B − V)⊙.
However, we have also estimated, using Full Moon images from JD 2 455 814, the intrinsic difference in B − V colour between the selected areas in Mare Crisium and Oceanus Procelarum to be 0.051 ± 0.002 mag with Mare Crisium being redder. This implies that the true colour of the Earthlight, as seen from the Moon, was 0.051 mag bluer than the Earthshine, or that the B − V for Earthlight is 0.49−0.051 = 0.44 ± 0.02 mag. Since phase-dependent reddening occurs when light strikes the Moon the value is a lower limit on earthlight’s B − V colour. The phase-dependence of the reddening is poorly known so we do not correct for it – but orders of magnitude can be given: McCord (1969) measured (at 90 degree phase, for reference) a 3% effect, while Lane & Irvine (1973) found a 10% effect at the same angle, so the order of magnitude of the reddening for the relevant observations we, and Franklin have are from several hundredths of a magnitude to tenths.
A strong scattered-light halo is typically present surrounding the BS in any image of the Moon. Typical B − V images obtained at other phases and other nights show strong spatial gradients. Both the B and V images we use here show halos (Fig. 2), so the absence of a gradient in the B − V image implies conditions such that halos cancelled. By selecting a crescent phase, and undoubtedly being lucky with conditions on the given night we have found halo strengths and profiles in B and V that are matched. This may have implications for understanding the origin of the scattering. If the halos are due to wavelength-dependent processes – such as atmospheric Rayleigh–, and to a lesser extent Mie-scattering, then they would not be expected to cancel so cleanly – and this is certainly the case on most other nights. Scattering also originates in the telescope optics from micro-scratches and optical imperfections, and aberration due to the optics. The Lyot stop removes most of the non-axially scattered light that enters the first of the secondary lenses, but a remnant is left which produces at least part of the halo. This is seen by inserting the occulting device in the prime focus and imaging various sources – behind the solid knife edge a halo is evident; thus at least part of the halo is formed in optics or devices that follow the prime focus. On less perfect nights a contribution to the halo is also made by the atmosphere – it is stronger and also wavelength dependent and thus cannot be expected to be removed by subtraction. This argument implies that whatever processes are causing scattering in the telescope itself are either not wavelength dependent or are very weak.
2.1. Error limits of the technique
We can assess the minimum possible error in the B − V determinations by using synthetic lunar models with appropriate Poisson noise, but with all problems due to realistic observing limitations omitted. We have a code which can produce artificial images of the Moon for any of our observations from Hawaii, and we use bootstrapping with replacement on subregion pixels on an appropriate artificial image and repeatedly evaluate the mean colour difference. Extracting the standard deviation for the distribution we can determine the uncertainty due to Poisson noise, the centering of the moon, and pixel selection. We find that errors can be as low as ±0.002 mag ideally (whereas we observe the error to be ±0.005 mag) in comparisons between a DS and BS region. The minimum error when comparing two BS regions is ±0.0004 mag compared to about ±0.002 mag in the case of the real observed images. We conclude that there is a factor of from two to five between the lowest errors possible given Poisson statistics and what we find in real data. Improvements could potentially be made in our analysis, particularly in areas related to bias subtraction, flat fielding, and image alignment. Reduction in errors beyond that could be based on using more than 100 images per stack, which is the current limit of the image-buffer in our camera.
3. Comparison to other work
The literature on lunar dark-side photometry and colorimetry is dominated by the early works of Danjon and Dubois (Danjon 1933; Dubois 1943, 1947, 1955), but unfortunately their pioneering work is difficult to interpret in terms of modern photometry. This is quite a pity, because they have produced the longest set of Earthshine colour measurements. In trying to make use of their photometry, we are mainly hampered by a lack of understanding of the light-scattering properties of their equipment, and of the atmospheric (scattering) conditions on individual observing nights. Furthermore, their observing procedures did not compensate for the spatial gradient in the scattered light. However, if we use the decadal-mean values given by Danjon (1933) – and note the addendum provided there – comparison with our own work is possible. Danjon worked in the “Rougier” filter system and gives colour index values for earthshine as well as earthlight. The data can be converted to Johnson B − V by use of the Rougier colour index for the sunlit Moon, the Sun and their known B − V values (Wildey 1964). We find that B − V corresponding to Danjon’s average data is 0.35 with limits from 0.12 to 0.53. The wide limits are stated by Danjon as being due to seasonal variations in earthshine colour as seen from their observing site in France.
The only other measurement of lunar dark-side in Johnson photometry which we could find in the refereed literature is by Franklin (1967), who performed DS aperture photometry referenced to standard stars and reported a difference between B − V from the DS to the BS of − 0.17, on average (i.e. DS bluer) for Mare Crisium and Ocean Procelarum locations. We have used his data to calculate the standard deviation in this value and find σ = 0.05 mag. In this paper, we find a colour change of Δ(B − V)DS−BS = −0.150 ± 0.005 mag from our observations, so the two measurements are consistent.
Recently, the Cassini Solstice mission acquired images of the Earth and Moon as seen from beyond Saturn – unfortunately, pixels in the image of Earth (in the press-release images) are saturated and photometric analysis of these data does not appear possible. Potentially, the original data could be utilized, and we are continuing work on this. A similar situation applies to recent Juno spacecraft images.
Instruments in lunar orbit can observe the DS, but it is still challenging to do so as the Earthshine is intrinsically faint and exposure times become so long that image blur can occur due to platform motion. The lunar Reconnaissance Orbiter has taken several images of the DS, available in the Jet Propulsion Laboratory public data archives, but inspection shows that only very faint DS levels are present because the exposure time settings are set optimally for imaging of the BS.
Low-Earth orbit satellites daily take images of Earth, and in many spectral bands, but we have found no conversion to the Johnson system. LEO imagery is unsuited for building instantaneous full-disc images of Earth, due to the long revisit time for a given area. Geo-stationary satellites take full-disc images, but only in one visual and a number of near-IR and longer bands, which does not allow for a transformation to the Johnson system. No readily useful spacecraft-based Johnson B − V results for the lunar DS or the earthlight therefore exist.
Observed spectra of Earthshine have been published (Dunham 1936; Woolf et al. 2002; Arnold et al. 2002; Montañés-Rodriguez et al. 2005; Turnbull et al. 2006; Hamdani et al. 2006) but are mainly unsuitable for spectro-photometry in the visual wavelength range as they are presented mainly for discussions of telluric signatures in the red, near-IR and IR parts of the spectrum, and not in terms of absolute flux calibration or photometric colours. We contribute calibrated Johnson B − V colours as a first step in this direction. Other papers are devoted to polarimetry of the earthshine (Bazzon et al. 2013; Takahashi et al. 2013), and their results are not suited for spectro-photometry. González-Merino et al. (2013) show normalized high-resolution spectra in a narrow wavelength range only. On the basis of the earthlight spectrum for 31 May 2005, in Hamdani et al. (2006), we estimate (B − V)EL = 0.53 ± 0.05, which is redder than what we derive. Daily variations in the earthshine spectrum shown in Hamdani et al. (2006) correspond to 0.05 mag in B − V. Our own estimates of daily variations of earthshine flux, based on satellite data, is 20%, at quarter phase, so we see no disagreement between our observation and the one based on published spectra.
Of related interest to us are the GOME (Global Ozone Monitoring Experiment) disk-averaged observations of the (Sun-lit) Moon (Dobber 1997; Dobber et al. 1998) – the results for the wavelength dependent lunar albedo can be used to determine BS B − V, based on reference spectra of the Sun, such as the Wehrli (1985) spectrum. Multiplying this spectrum with the GOME albedo law, which is almost linear in wavelength – Fig. 4 in Dobber et al. (1998), and applying B- and V-filter transmission curves, we derive  mag. This is 0.25 mag redder than the Wehrli-based solar
  colour of 0.63 mag, which we compute in the same way. The difference between observed values of B − V of the Sun (Holmberg et al. 2006, 0.64 ± 0.02 mag) and our BS observations of the Moon is 0.26 ± 0.02 mag, consistent with the GOME-based result.
We note that the colour for Earth given in Cox (2000); Allen (1975, 1955) is B − V = 0.2, but it is unclear whence the value originates. In the 1955 edition of Allen, work by Danjon (1933) is cited, but as far as we can see, Danjon gives values for the colour index inconsistent with B − V = 0.2. Accompanying notes in Allen refer to a reduction of the published value of the planetary colour index by 0.1 to 0.2 to satisfy observations, but the origin of this correction is unclear. As seen above, the B − V equivalent to the Rougier colour index values places the Earthlight colour in a range consistent with the Allen value of “0.2”, but we suggest that the Danjon-based mean value of B − V = 0.35 mag be used instead.
4. Summary
We have obtained B- and V-band images of the Moon on JD 2 455 945.177. We construct a B − V image and find area-mean values for the dark-side to bright-side B − V difference, using reference areas defined in Franklin (1967). We have used relative photometric observing- and data-reduction methods, thereby eliminating important sources of potential bias such as dependencies on detector sensitivity variations in time, extinction corrections and exposure times. Currently, error limits are not set by the inherent Poisson statistics, and errors could potentially be lowered by factors of 2−5 with careful attention paid to data-reduction techniques; after that improvements can be expected by increasing the number of images used in the stacks.
We have shown that the B − V colour of Earthshine, determined from a pair of B and V image stacks, taken on a photometrically exceptional night at Mauna Loa with our Earthshine telescope, agrees within errors with the only other published dark side B − V value, that by Franklin (1967) observed 45 years earlier, and is in general agreement with the broad limits set by Danjon and Dubois’ work 1930s−1950s.
This paper has been about a single pair of fortuitously identified images. We have 500 more, but they are not suited for this type of analysis – their halos do not match. We cannot rely on the present method for analysis of long-term evolution of earthshine unless a method can be found to convert existing pairs of images to pairs where the halos match. It may be possible to transform images suitably by adaptive convolution methods. Time will tell if that approach works; in the meantime work will continue on a different type of analysis – forward modelling of the scattered light – and albedos in 5 colour bands will be presented in a future publication.
Acknowledgments
This work was supported by the Danish Climate Centre at The Danish Meteorological Institute. We thank VINNOVA for the funding that made the earthshine project possible, and NOAA staff for their assistance at Mauna Loa during observations. We thank the University of New Hampshire for the use of their GroundWinds project dome. Ana Ulla thanks the University of Vigo for funding under grant 12VI20. M. Collados and R. López are thanked for technical discussions on the optical configuration of the telescope. Ben Berkey helped us extensively and knowledgeably at MLO and is warmly thanked. John Sarkissian is thanked for very useful discussions on lunar colours, and Luc Arnold provided access to his earthshine spectra, for which we are most grateful. Comments and suggestions from an anonymous referee are warmly acknowledged. This research has made use of the WEBDA database, operated at the Department of Theoretical Physics and Astrophysics of the Masaryk University.
References
- Allen, C. W. 1955, Astrophysical quantities (University of London, The Athlone Press) [Google Scholar]
- Allen, C. W. 1975, Astrophysical Quantities (University of London, The Athlone Press) [Google Scholar]
- Arnold, L., Gillet, S., Lardière, O., Riaud, P., & Schneider, J. 2002, A&A, 392, 231 [NASA ADS] [CrossRef] [EDP Sciences] [MathSciNet] [Google Scholar]
- Bakos, G. A. 1964, SAO Special Report, 162 [Google Scholar]
- Bazzon, A., Schmid, H. M., & Gisler, D. 2013, A&A, 556, A117 [NASA ADS] [CrossRef] [EDP Sciences] [Google Scholar]
- Bender, F. A.-M., Rodhe, H., Charlson, R. J., Ekman, A. M. L., & Loeb, N. 2006, Tellus Series A, 58, 320 [Google Scholar]
- Bessell, M. S., Castelli, F., & Plez, B. 1998, A&A, 333, 231 [NASA ADS] [Google Scholar]
- Boyd, A. K., Robinson, M. S., & Sato, H. 2012, in Lunar and Planetary Institute Science Conf. Abstracts, 43, 2795 [Google Scholar]
- Colina, L., Bohlin, R. C., & Castelli, F. 1996, AJ, 112, 307 [NASA ADS] [CrossRef] [Google Scholar]
- Cox, A. N. 2000, Allen’s Astrophysical Quantities (New York: AIP Press, Springer-Verlag) [Google Scholar]
- Danjon, A. 1933, Annales de l’Observatoire de Strasbourg, 3, 138 [NASA ADS] [Google Scholar]
- Darudi, A., Owner-Petersen, M., Thejll, P., et al. 2010, in Proc. SPIE, 7733, 2V [Google Scholar]
- Dobber, M. R. 1997, in Third ERS Symposium on Space at the service of our Environment, eds. T.-D. Guyenne, & D. Danesy, ESA SP, 414, 743 [Google Scholar]
- Dobber, M. R., Goede, A. P. H., & Burrows, J. P. 1998, Appl. Opt., 37, 7832 [NASA ADS] [CrossRef] [Google Scholar]
- Dubois, J. 1947, Bulletin Astronomique, 13, 193 [NASA ADS] [Google Scholar]
- Dubois, J. E. 1943, Ciel et Terre, 59, 375 [NASA ADS] [Google Scholar]
- Dubois, J. 1955, L’Astronomie, 69, 242 [NASA ADS] [Google Scholar]
- Dunham, Jr., T. 1936, in PAAS, 8, 7 [Google Scholar]
- Efron, B., & Tibshirani, R. 1993, An Introduction to the Bootstrap (Chapman & Hall) [Google Scholar]
- Flatté, S., Koonin, S., & MacDonald, G. 1992, Global Change and the Dark of the Moon, Tech. Rep., The MITRE Corporation, jSR-91-315 [Google Scholar]
- Franklin, F. A. 1967, J. Geophys. Res., 72, 2963 [NASA ADS] [CrossRef] [Google Scholar]
- González-Merino, B., Pallé, E., Motalebi, F., Montañés-Rodríguez, P., & Kissler-Patig, M. 2013, MNRAS, 435, 2574 [NASA ADS] [CrossRef] [Google Scholar]
- Goode, P. R., Qiu, J., Yurchyshyn, V., et al. 2001, Geophys. Res. Lett., 28, 1671 [NASA ADS] [CrossRef] [Google Scholar]
- Goode, P. R., Shoumko, S., Pallé, E., & Montañés-Rodríguez, P. 2010, Adv. Astron., 2010 [Google Scholar]
- Hamdani, S., Arnold, L., Foellmi, C., et al. 2006, A&A, 460, 617 [NASA ADS] [CrossRef] [EDP Sciences] [Google Scholar]
- Hiltner, W. A., Iriarte, B., & Johnson, H. L. 1958, ApJ, 127, 539 [NASA ADS] [CrossRef] [Google Scholar]
- Holmberg, J., Flynn, C., & Portinari, L. 2006, MNRAS, 367, 449 [NASA ADS] [CrossRef] [Google Scholar]
- Lane, A. P., & Irvine, W. M. 1973, AJ, 78, 267 [NASA ADS] [CrossRef] [Google Scholar]
- Lyot, B. 1939, MNRAS, 99, 580 [NASA ADS] [CrossRef] [Google Scholar]
- McCord, T. B. 1969, AJ, 74, 273 [NASA ADS] [CrossRef] [Google Scholar]
- Montañés-Rodriguez, P., Pallé, E., Goode, P. R., Hickey, J., & Koonin, S. E. 2005, ApJ, 629, 1175 [NASA ADS] [CrossRef] [Google Scholar]
- Noll, R. J. 1973, J. Opt. Soc. Am., 63, 1399 [NASA ADS] [CrossRef] [Google Scholar]
- Øelund, J. K. B. 2013, Bsc thesis, Københavns Universitet, Denmark [Google Scholar]
- Owner-Petersen, M., Andersen, T., Ardeberg, A., Thejll, P., & Gleisner, H. 2008, in Proc. SPIE, 7012, 2L [Google Scholar]
- Rydgren, B. 1966, Arkiv för Astronomi, 4, 131 [Google Scholar]
- Stone, T. C. 2008, in Proc. SPIE, 7081, 0X [Google Scholar]
- Takahashi, J., Itoh, Y., Akitaya, H., et al. 2013, PASJ, 65, 38 [NASA ADS] [CrossRef] [Google Scholar]
- Turnbull, M. C., Traub, W. A., Jucks, K. W., et al. 2006, ApJ, 644, 551 [NASA ADS] [CrossRef] [Google Scholar]
- Velikodsky, Y., & Volvach, Y. 2011, Lunar and Planetary, 44, 2010 [Google Scholar]
- Velikodsky, Y. I., Opanasenko, N. V., Akimov, L. A., et al. 2011, Icarus, 214, 30 [NASA ADS] [CrossRef] [Google Scholar]
- Wehrli, C. 1985, Extraterrestrial Solar Spectrum, Tech. Rep., Physikalisch-Meteorologisches Observatorium Davos and World Radiation Center, Davos-Dorf, Switzerland [Google Scholar]
- Wildey, R. L. 1964, J. Geophys. Res., 69, 4661 [NASA ADS] [CrossRef] [Google Scholar]
- Woolf, N. J., Smith, P. S., Traub, W. A., & Jucks, K. W. 2002, ApJ, 574, 430 [NASA ADS] [CrossRef] [Google Scholar]
- Yokota, Y. 2012, in Lunar and Planetary Institute Science Conf. Abstracts, 43, 810 [Google Scholar]
- Yokota, Y., Matsunage, T., Ohtake, M., & et al. 2011, Icarus, 215, 639 [NASA ADS] [CrossRef] [Google Scholar]
All Tables
All Figures
|
Fig. 1 B − V image (upper panel) of the waning crescent Moon on JD 2 455 945.177. False colours represent B − V values; the DS is blue and to the left of the image; the bar shows B − V and corresponding colours. The finder chart (lower panel) shows the measurement areas in Mare Crisium and Oceanus Procelarum. Subtle colour differences, corresponding to M. Crisium, M. Fecunditatis, M. Nectaris, Tycho and adjoining M. Nubium can be recognized using the finder chart. Lines of equal longitude and latitude are drawn at 30° intervals. Eastern longitudes are to the left of the images. A colour version of this figure is available online. |
| In the text | |
|
Fig. 2 Row-slices across the Moon, through disc centre, on two nights, to illustrate halo profiles and intensities. The upper row is from a night when the B and V halos did not cancel, while the lower row is from the unique night JD 2 455 945.17, when the halos did cancel on the DS part of the lunar disc. The left column shows profiles (B is in blue, and V is in red; V is the upper profile), while the right column shows the B/V flux ratio. Horizontal dashed line shows the zero flux level. Vertical dashed lines show the disc edges. Orientation of DS and BS are as in Fig. 1. A colour version of this figure is available online. |
| In the text | |
Current usage metrics show cumulative count of Article Views (full-text article views including HTML views, PDF and ePub downloads, according to the available data) and Abstracts Views on Vision4Press platform.
Data correspond to usage on the plateform after 2015. The current usage metrics is available 48-96 hours after online publication and is updated daily on week days.
Initial download of the metrics may take a while.