Fig. 2
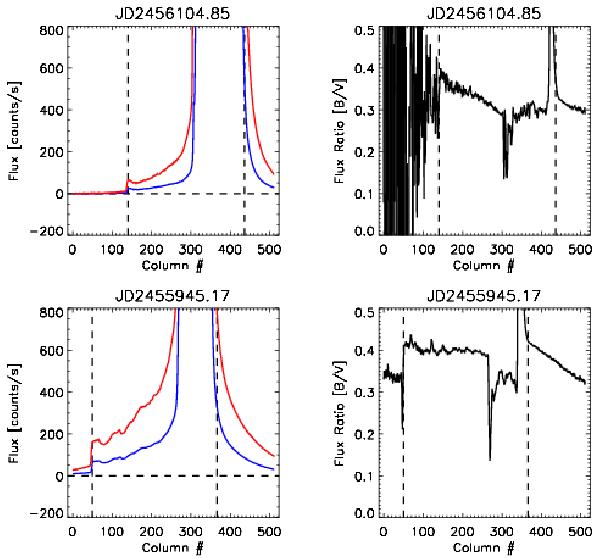
Row-slices across the Moon, through disc centre, on two nights, to illustrate halo profiles and intensities. The upper row is from a night when the B and V halos did not cancel, while the lower row is from the unique night JD 2 455 945.17, when the halos did cancel on the DS part of the lunar disc. The left column shows profiles (B is in blue, and V is in red; V is the upper profile), while the right column shows the B/V flux ratio. Horizontal dashed line shows the zero flux level. Vertical dashed lines show the disc edges. Orientation of DS and BS are as in Fig. 1. A colour version of this figure is available online.
Current usage metrics show cumulative count of Article Views (full-text article views including HTML views, PDF and ePub downloads, according to the available data) and Abstracts Views on Vision4Press platform.
Data correspond to usage on the plateform after 2015. The current usage metrics is available 48-96 hours after online publication and is updated daily on week days.
Initial download of the metrics may take a while.