Fig. 1
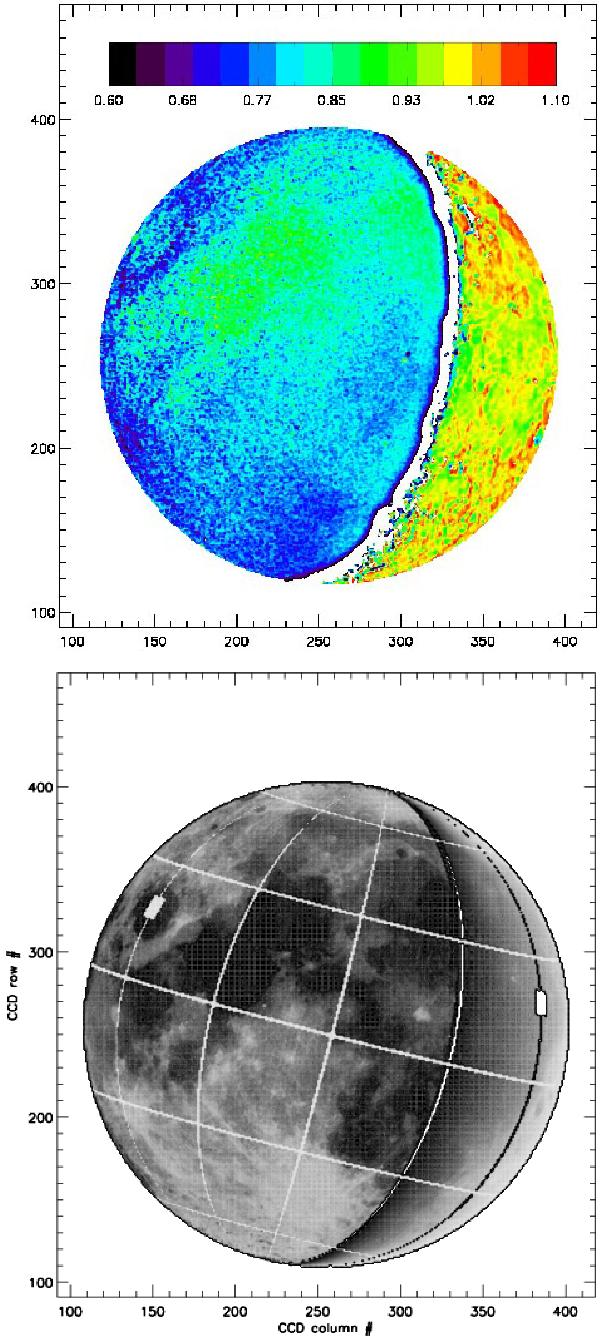
B − V image (upper panel) of the waning crescent Moon on JD 2 455 945.177. False colours represent B − V values; the DS is blue and to the left of the image; the bar shows B − V and corresponding colours. The finder chart (lower panel) shows the measurement areas in Mare Crisium and Oceanus Procelarum. Subtle colour differences, corresponding to M. Crisium, M. Fecunditatis, M. Nectaris, Tycho and adjoining M. Nubium can be recognized using the finder chart. Lines of equal longitude and latitude are drawn at 30° intervals. Eastern longitudes are to the left of the images. A colour version of this figure is available online.
Current usage metrics show cumulative count of Article Views (full-text article views including HTML views, PDF and ePub downloads, according to the available data) and Abstracts Views on Vision4Press platform.
Data correspond to usage on the plateform after 2015. The current usage metrics is available 48-96 hours after online publication and is updated daily on week days.
Initial download of the metrics may take a while.