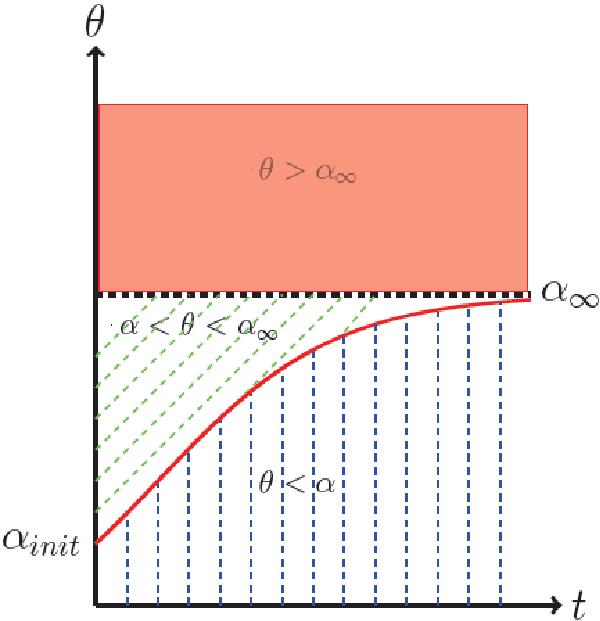
Fig. 8

Sketch of the different regions in pitch angle vs. time evolution in a CMT. The red curve represents the time evolution of the loss cone angle α(t), which starts at a value αinit and then increases with time towards an asymptotic value α∞. The blue hatched region represents the orbits with pitch angles less than the loss cone angle which are lost. Orbits with initial pitch angles greater than α∞ (brown shaded region) remain trapped (although see discussion in main text). For orbits with initial pitch between αinit and α∞ (green hatched region) the outcome depends on the relative importance of Fermi vs. Betatron acceleration.
Current usage metrics show cumulative count of Article Views (full-text article views including HTML views, PDF and ePub downloads, according to the available data) and Abstracts Views on Vision4Press platform.
Data correspond to usage on the plateform after 2015. The current usage metrics is available 48-96 hours after online publication and is updated daily on week days.
Initial download of the metrics may take a while.


