Fig. 7
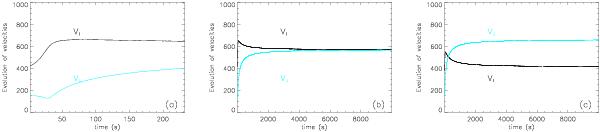
Subcritical a), critical b), and supercritical c) time evolution of parallel and perpendicular velocity for the particle orbits whose pitch angle evolution is shown in Fig. 6. A key feature is that v∥ (black curves) reaches a plateau or even decreases slightly after an initial rapid increase, while v⊥ (blue) still continues to increase.
Current usage metrics show cumulative count of Article Views (full-text article views including HTML views, PDF and ePub downloads, according to the available data) and Abstracts Views on Vision4Press platform.
Data correspond to usage on the plateform after 2015. The current usage metrics is available 48-96 hours after online publication and is updated daily on week days.
Initial download of the metrics may take a while.