Free Access
Fig. 2
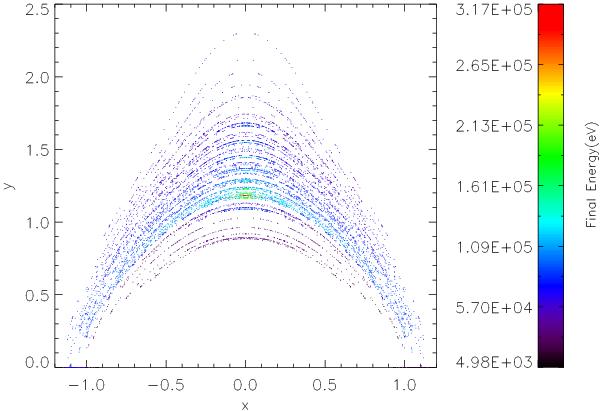
Graph of final position with corresponding energy. The colour bar gives the final energy of the trapped particles. The highest energies are found to be trapped in the middle of the trap.
Current usage metrics show cumulative count of Article Views (full-text article views including HTML views, PDF and ePub downloads, according to the available data) and Abstracts Views on Vision4Press platform.
Data correspond to usage on the plateform after 2015. The current usage metrics is available 48-96 hours after online publication and is updated daily on week days.
Initial download of the metrics may take a while.