Fig. 2
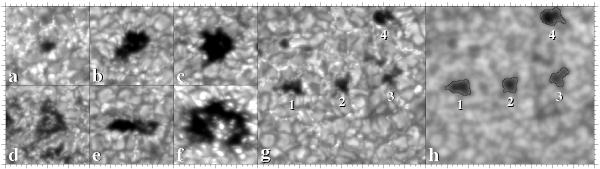
Sample of different types of pores panels a)–g) extracted from the full-sized G-band images. The images are displayed in the range 0.4−1.4 I0. Major tick marks are separated by 2 Mm. The application of a Perona-Malik filter to the G-band image in panel g) is shown in panel h). This filter facilitates the extraction of pores by intensity thresholding. The contours of the pores are marked by solid lines in panel h). Characteristic parameters of the pores are given in Table 2.
Current usage metrics show cumulative count of Article Views (full-text article views including HTML views, PDF and ePub downloads, according to the available data) and Abstracts Views on Vision4Press platform.
Data correspond to usage on the plateform after 2015. The current usage metrics is available 48-96 hours after online publication and is updated daily on week days.
Initial download of the metrics may take a while.