Free Access
Fig. 6
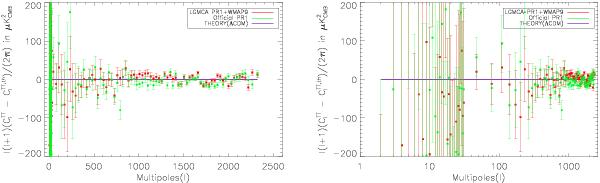
Left: difference between the power spectrum estimated from the WPR1 LGMCA map (red) (resp. official PR1 power spectrum (green)) and the Planck-only best fit Cℓ provided by the Planck consortium. Right: difference between the estimated and theoretical power spectra on logarithmic scale. Error bars are set to 1σ.
This figure is made of several images, please see below:
Current usage metrics show cumulative count of Article Views (full-text article views including HTML views, PDF and ePub downloads, according to the available data) and Abstracts Views on Vision4Press platform.
Data correspond to usage on the plateform after 2015. The current usage metrics is available 48-96 hours after online publication and is updated daily on week days.
Initial download of the metrics may take a while.