Fig. 7
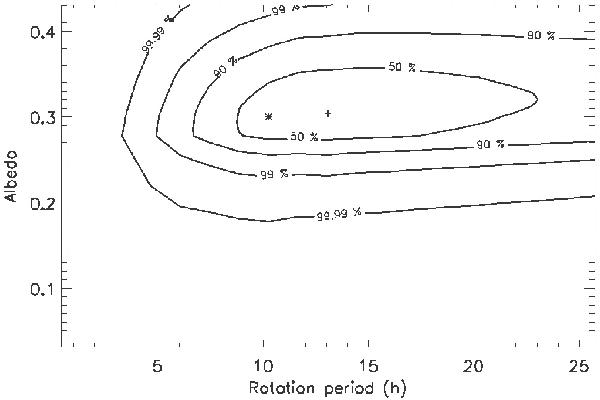
χ2 map comparing a simulated observation of a rotating CoRoT-7b with a 0.3 Bond albedo to a family of models with various albedos, rotation periods, and an inertia-layer thickness of 25 cm. The cross is at the location of the best fitted model in the albedo–period space, and the star marks the position of the initial model (albedo =0.3 and rotation period =10.25 h =1/2 orbital period of CoRoT-7b).
Current usage metrics show cumulative count of Article Views (full-text article views including HTML views, PDF and ePub downloads, according to the available data) and Abstracts Views on Vision4Press platform.
Data correspond to usage on the plateform after 2015. The current usage metrics is available 48-96 hours after online publication and is updated daily on week days.
Initial download of the metrics may take a while.