Free Access
Fig. 5
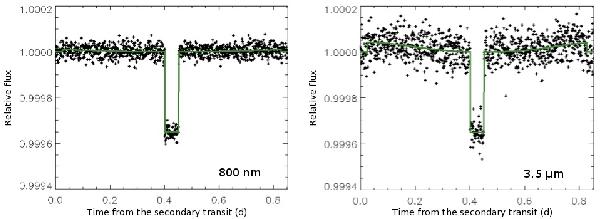
Simulated light curves corresponding to two extreme wavelengths of the observation using JWST-Nirspec. In the left panel, the ideal light-curve (solid green line) expected at 800 nm and the same with the added noise (black cross). The same symbol and color code are used in the right panel for a wavelength of 3.5 μm.
Current usage metrics show cumulative count of Article Views (full-text article views including HTML views, PDF and ePub downloads, according to the available data) and Abstracts Views on Vision4Press platform.
Data correspond to usage on the plateform after 2015. The current usage metrics is available 48-96 hours after online publication and is updated daily on week days.
Initial download of the metrics may take a while.