Free Access
Fig. 4
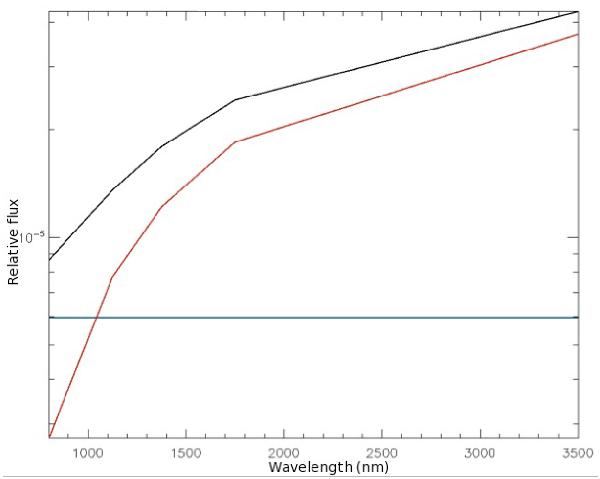
Contribution to the phase curve variation of the reflected light (blue line), thermal emission (red) and total (black). In this example, we took an albedo value of 0.5, so that the reflected flux from the star is higher than the emitted thermal flux from the planet only at wavelengths lower than 1000 nm.
Current usage metrics show cumulative count of Article Views (full-text article views including HTML views, PDF and ePub downloads, according to the available data) and Abstracts Views on Vision4Press platform.
Data correspond to usage on the plateform after 2015. The current usage metrics is available 48-96 hours after online publication and is updated daily on week days.
Initial download of the metrics may take a while.