Fig. 12
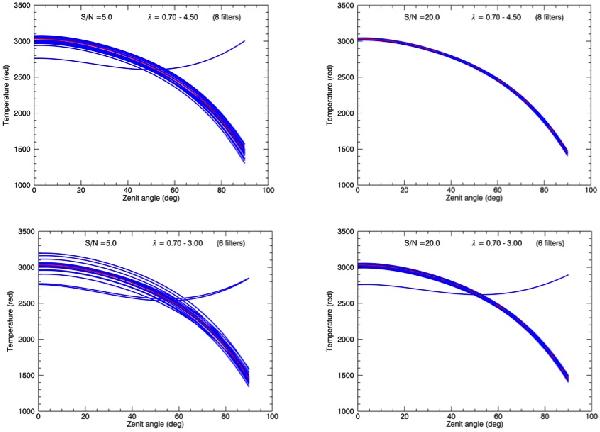
Four examples of temperature distribution retrieval from realistic observations of the planet spectrum using the JWST-NIRSPEC instrument. For each case, 20 trials were done (blue curves). The temperature distribution to be retrieved corresponds to the red curve. The label indicates the conditions in terms of S/N (at the longest wavelength) and of wavelength range. In a few cases, one notes that one or two catastrophic solutions are found. For a S/N = 20 and a wavelength range extending to 4.5 μm, the accuracy on the retrieval of the initial distribution is good (<10 K), and no catastrophic solution is found.
Current usage metrics show cumulative count of Article Views (full-text article views including HTML views, PDF and ePub downloads, according to the available data) and Abstracts Views on Vision4Press platform.
Data correspond to usage on the plateform after 2015. The current usage metrics is available 48-96 hours after online publication and is updated daily on week days.
Initial download of the metrics may take a while.